With the date for pitchers and catchers to report being announced as February 14th, I think it’s only fair to look ahead to everyone’s favorite time of year, projection season. As you know, the projection systems don’t tend to be so kind to the Royals. Why that is has been discussed all over the internet, and you may roll your eyes at the explanations, but hey, they’re just computers. You can put stock in them or not. To me, projections are a discussion tool. So let’s discuss them, and before they’re released for the 2017 season, let’s take a look at how they did during the 2016 season for the Royals.
We’ll start with the offense.
The Hits
These are at the very least close enough to be considered successes. I counted just three for the offense.
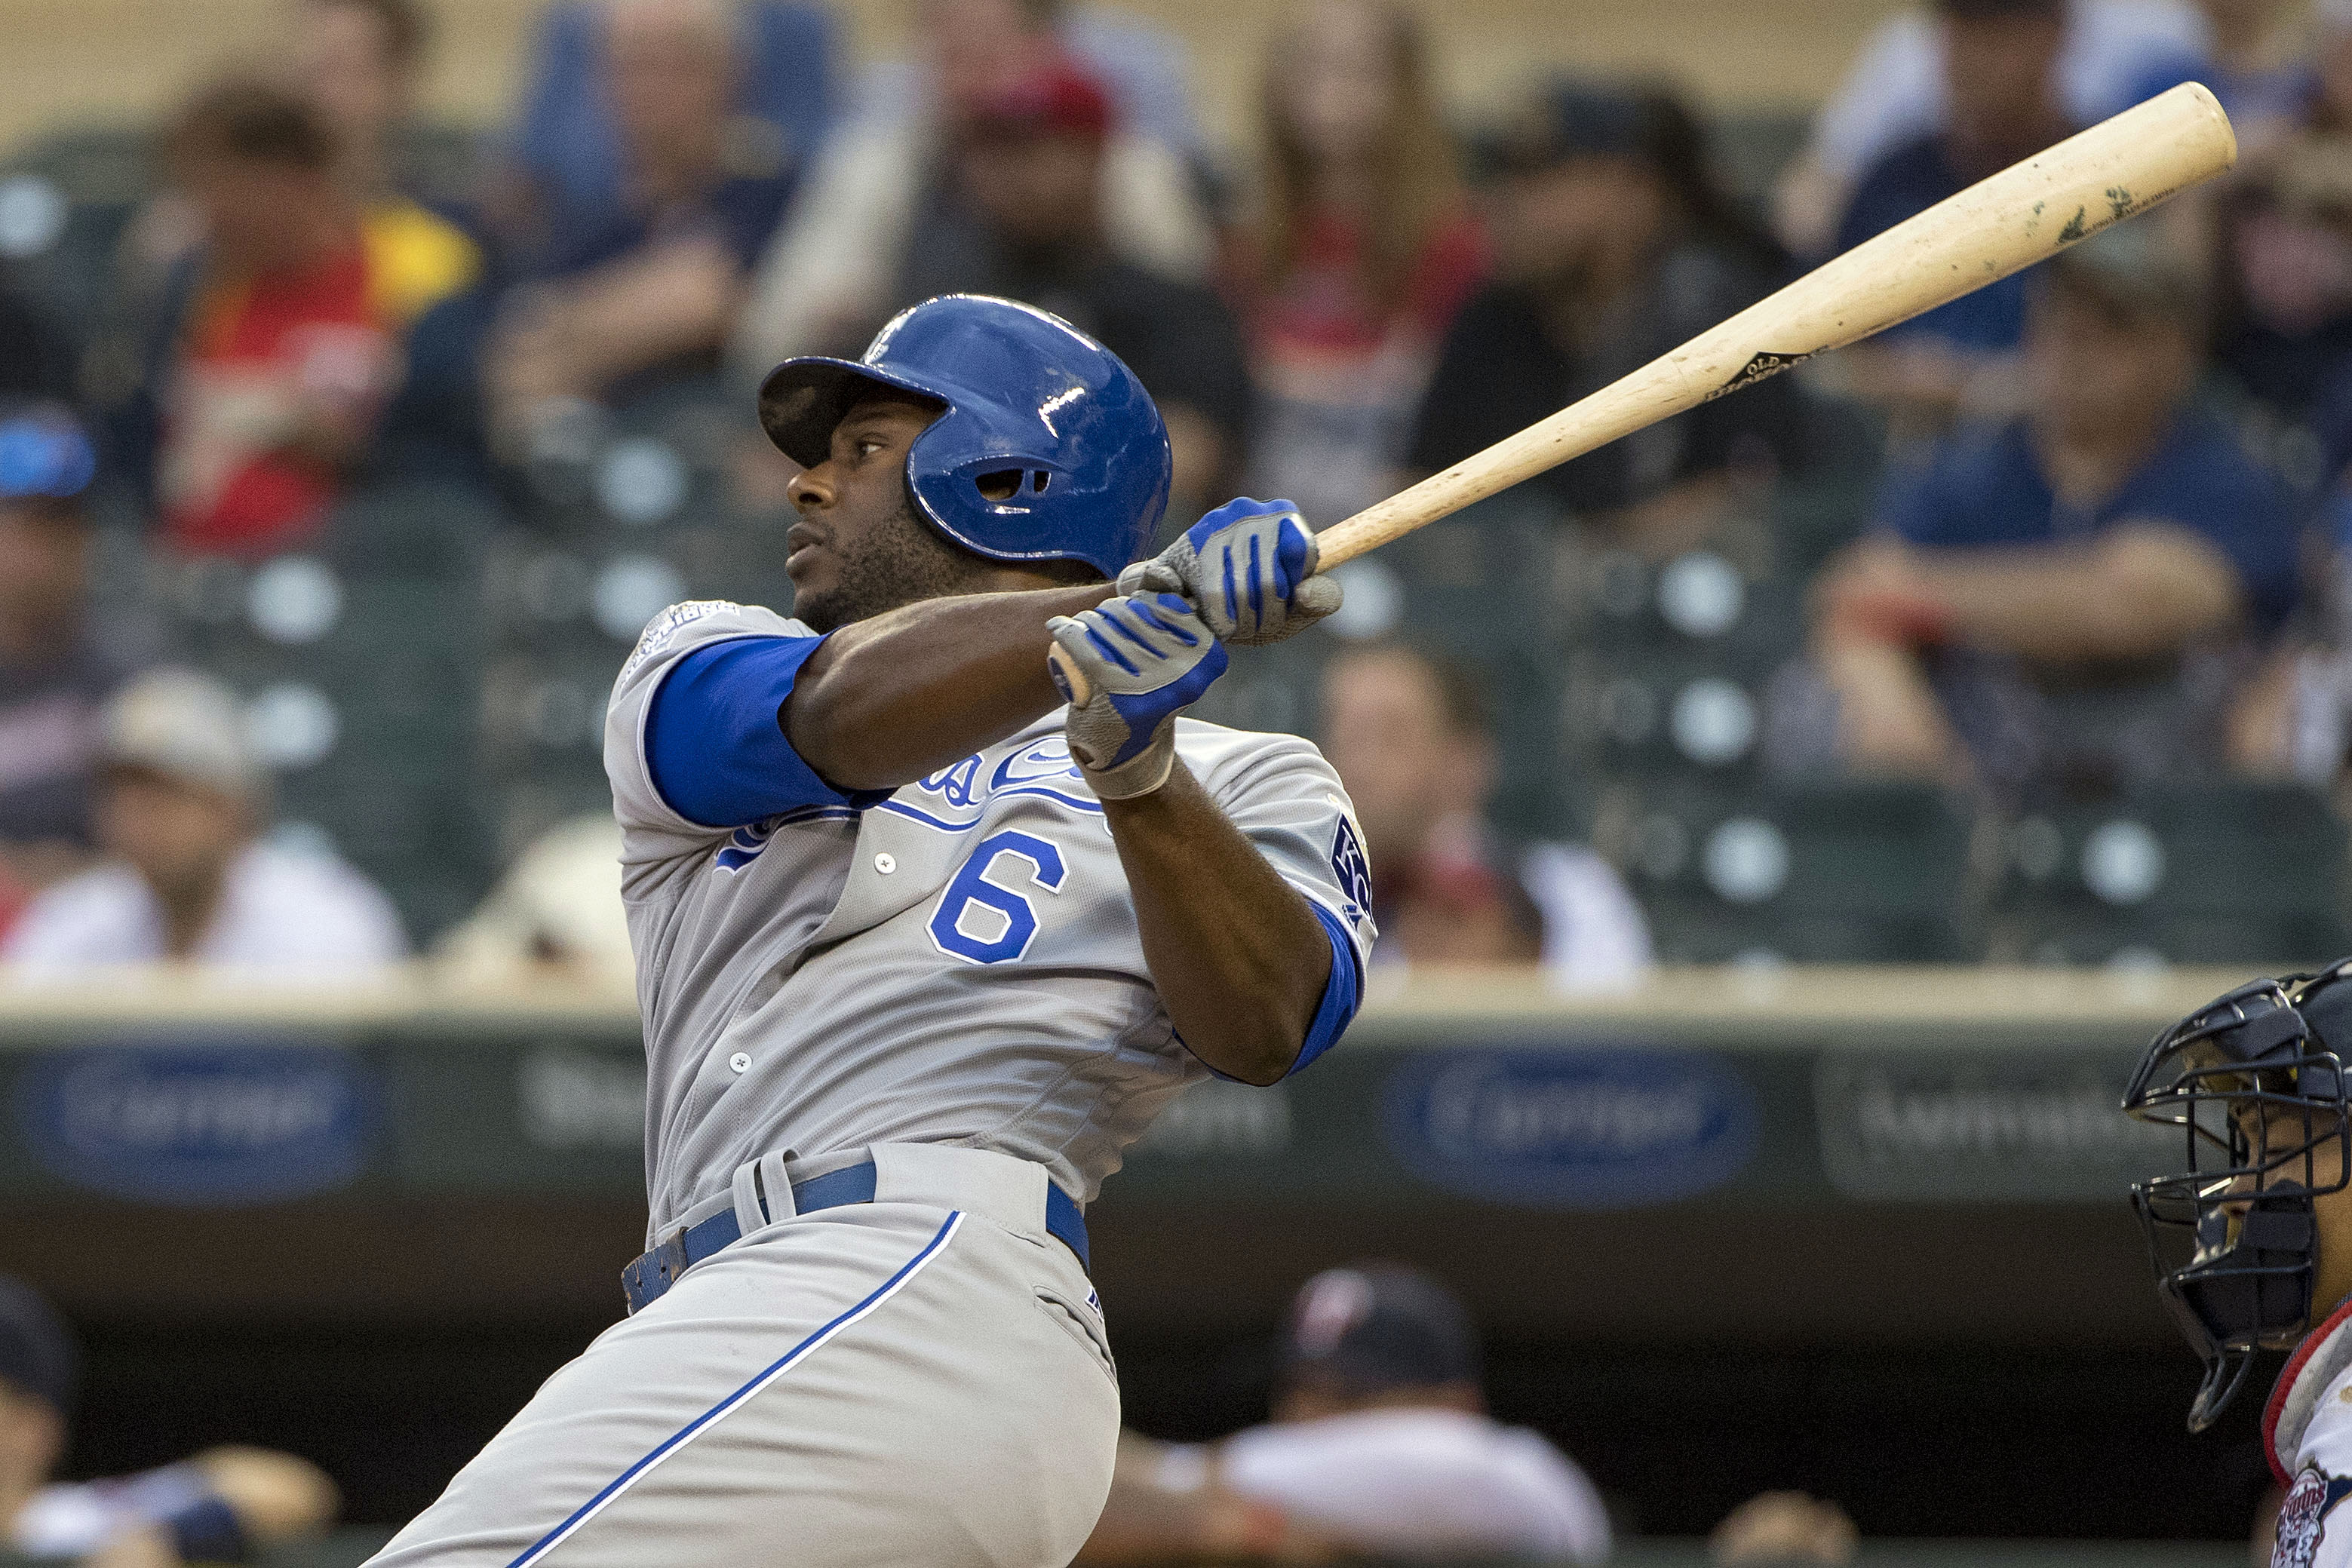
Lorenzo Cain
| AVG | OBP | SLG | TAv | |
| PECOTA | .269 | .321 | .398 | .262 |
| Actual | .287 | .339 | .408 | .258 |
The projection was a little light on average, which kind of confused me after two straight years of hitting .300, but wasn’t too far off in general given that the run scoring environment changed almost on a dime. That led to his TAv (true average) has basically being nailed right on the head on this one.
Kendrys Morales
| AVG | OBP | SLG | TAv | |
| PECOTA | .263 | .322 | .425 | .273 |
| Actual | .263 | .327 | .468 | .270 |
Other than the slugging percentage, that’s actually a really impressive projection compared to the reality. I think a lot of the SLG had to do with the way offense shifted, so PECOTA gets a ton of credit on this one.
Alcides Escobar
| AVG | OBP | SLG | TAv | |
| PECOTA | .256 | .288 | .339 | .231 |
| Actual | .261 | .292 | .350 | .227 |
Yup. That’s our Esky.
The Misses
These misses were glaring. Some are understandable. Some, not so much.
Alex Gordon
| AVG | OBP | SLG | TAv | |
| PECOTA | .266 | .344 | .421 | .277 |
| Actual | .220 | .312 | .380 | .240 |
I think we can all agree that this was essentially a lost season for Gordon. Of course, PECOTA can’t predict injuries, but Gordon was having a lousy year before he got hurt too. At least he finished the season decently, giving some hope that he’ll have a bounce back year in 2017.
Mike Moustakas
| AVG | OBP | SLG | TAv | |
| PECOTA | .245 | .301 | .398 | .254 |
| Actual | .240 | .301 | .500 | .281 |
So this one isn’t completely fair because Moose missed so much of the season, but PECOTA definitely underestimated his power. A big reason for that is the track record just wasn’t there. It’s hard to project what kind of power he’ll display moving forward due to his injury, but he did show to start 2016 that the 2015 power didn’t appear to be a fluke.
Jarrod Dyson
| AVG | OBP | SLG | TAv | |
| PECOTA | .243 | .300 | .319 | .232 |
| Actual | .278 | .340 | .388 | .250 |
Dyson had a really solid season for the Royals, and while his value remains the highest when he has a glove on his hand, he hit well in 2016. He showed he can get on base and even has a little pop in his bat. I’m not sure the projections will give him a ton of credit in 2017, but they definitely missed this year.
Paulo Orlando
| AVG | OBP | SLG | TAv | |
| PECOTA | .246 | .280 | .350 | .231 |
| Actual | .302 | .329 | .405 | .257 |
I don’t think it’s sustainable, but Orlando did a nice job for the Royals in 2016. What’s unfortunate is he doesn’t have any plate discipline to speak of and combines that with having shown very little real power, so that’s usually a recipe for regression. But in 2016, he showed PECOTA who the boss is.
Cheslor Cuthbert
| AVG | OBP | SLG | TAv | |
| PECOTA | .239 | .291 | .366 | .242 |
| Actual | .274 | .318 | .413 | .250 |
Cuthbert dropped off considerably toward the end of the year, but he showed way more in the big leagues than the projections pegged him for, so that’s good for the Royals.
Whit Merrifield
| AVG | OBP | SLG | TAv | |
| PECOTA | .250 | .290 | .348 | .236 |
| Actual | .283 | .323 | .392 | .253 |
I think projections are notoriously harder on non-prospects who are past the age where you can reasonably expect a breakout, so it’s no surprise they were so low on Merrifield, but he really took it to the projections this year.
Drew Butera
| AVG | OBP | SLG | TAv | |
| PECOTA | .198 | .249 | .283 | .199 |
| Actual | .285 | .328 | .480 | .268 |
Butera was a horrible hitter throughout his career and then 2016 happened. I don’t know where it came from and I don’t know if it can continue. But he was pretty darn good. PECOTA also missed badly on his pitching projection, but I’ll save them the shame of that entry.
The Toss-Ups
These are probably somewhere in the middle and actually feature two of the most important Royals for 2017.
Eric Hosmer
| AVG | OBP | SLG | TAv | |
| PECOTA | .276 | .335 | .423 | .274 |
| Actual | .266 | .328 | .433 | .261 |
So on one hand, PECOTA projected Hosmer to be better overall with a much better TAv than he actually posted, but they were awfully close on average and OBP, which is no small thing after he posted much better numbers in two of the last three seasons.
Salvador Perez
| AVG | OBP | SLG | TAv | |
| PECOTA | .273 | .303 | .422 | .265 |
| Actual | .247 | .288 | .438 | .245 |
PECOTA honestly probably just flat out missed here, but they were pretty close with the average/OBP spread and missed badly on the power, but a computer also can’t predict a change in approach.
Now let’s talk pitchers.
The Hits
Sometimes PECOTA just nails it. I think they did a pretty good job with these three.
Wade Davis
| W | L | ERA | DRA | K | BB | |
| PECOTA | 3 | 3 | 2.67 | 3.29 | 77 | 24 |
| Actual | 2 | 1 | 1.87 | 3.73 | 47 | 16 |
Part of why PECOTA projected a regression for Wade Davis was likely because it’s hard to be as good as he was for three consecutive seasons. Whatever the reason, projecting a DRA of over 3.00 and then him actually posting a DRA of over 3.00 is a hit in my book for PECOTA.
Ian Kennedy
| W | L | ERA | DRA | K | BB | |
| PECOTA | 10 | 11 | 4.17 | 4.63 | 157 | 62 |
| Actual | 11 | 11 | 3.68 | 4.71 | 184 | 66 |
Kennedy ended up throwing more innings than projected, so he struck out more hitters and walked a few more too, but the DRA was basically dead on. And, not that win-loss record is that important, but they nailed that too.
Joakim Soria
| W | L | ERA | DRA | K | BB | |
| PECOTA | 3 | 3 | 3.69 | 4.19 | 57 | 20 |
| Actual | 5 | 8 | 4.05 | 4.08 | 68 | 27 |
I think the assumption is that the Royals defense would help Soria more than it did. Either way, the projections showed a regression for Soria and regress he did.
The Misses
Again, you can’t blame the computer for not knowing, but some of these misses are so glaring that it leaves you wondering how.
Danny Duffy
| W | L | ERA | DRA | K | BB | |
| PECOTA | 6 | 7 | 4.13 | 4.55 | 89 | 42 |
| Actual | 12 | 3 | 3.51 | 3.46 | 188 | 42 |
Looks like they didn’t project that Duffy would break out and become the Royals best starting pitcher. For shame! Duffy’s season was one of the brightest spots in a season filled with dim spots. But hey, they projected his walks right on the nose, so there’s that.
Kris Medlen
| W | L | ERA | DRA | K | BB | |
| PECOTA | 7 | 9 | 4.24 | 4.71 | 86 | 38 |
| Actual | 1 | 3 | 7.77 | 5774 | 18 | 20 |
You might have forgotten that Medlen actually walked more batters than he struck out in his brief healthy time in the big leagues. If you did, I’ve reminded you. If you didn’t, then you were prepared. You know who wasn’t prepared for this? PECOTA.
Kelvin Herrera
| W | L | ERA | DRA | K | BB | |
| PECOTA | 3 | 3 | 3.80 | 4.26 | 53 | 22 |
| Actual | 2 | 6 | 2.75 | 2.79 | 86 | 12 |
So there was a big regression predicted probably because Herrera didn’t rack up enough strikeouts and he walked more than you’d like given his strikeout rate. Even with a terrible end to the season, Herrera managed to outperform basically every projection by striking out more hitters and walking less. Hopefully that September was just an aberration and he can come out of the gates in 2017 as dominant as he was in the first few months of the season.
The Toss-Ups
Much like a Ventura or Volquez start, it’s hard to say what’s right and wrong here.
Yordano Ventura
| W | L | ERA | DRA | K | BB | |
| PECOTA | 10 | 10 | 3.78 | 4.23 | 153 | 63 |
| Actual | 11 | 12 | 4.45 | 4.44 | 144 | 78 |
He walked more than he was expected to and he struck out less, but all in all, that’s not a big gap between projected DRAs. I don’t know. You could probably call this a miss with his ERA nearly three-quarters of a run higher than the projection, but I think there are some good elements to it.
Edinson Volquez
| W | L | ERA | DRA | K | BB | |
| PECOTA | 9 | 12 | 4.30 | 4.77 | 133 | 70 |
| Actual | 10 | 11 | 5.37 | 4.90 | 139 | 76 |
So the ERA was a full run off, but everything else was awfully close here. Volquez had a bad year, but I don’t think PECOTA did with this projection.
Luke Hochevar
| W | L | ERA | DRA | K | BB | |
| PECOTA | 3 | 3 | 3.34 | 3.86 | 56 | 20 |
| Actual | 2 | 3 | 3.86 | 3.50 | 40 | 9 |
He ended up having better control than expected and posted a better strikeout rate than expected, but something about his ERA matching his projected DRA made me think twice about calling this a miss.
If you’ll recall, PECOTA had the Royals pegged for 76 wins at the start of the season, a projection the Royals beat once again. This gap was a little smaller than the 23-win difference from 2015, but the difference came when the Royals had three regulars out for a considerable amount of time and saw injuries and ineffectiveness ravage the bullpen. So I’d say that’s still impressive. All in all, this projection business seems like a pretty tough job. I’m glad I’m just here to talk about it and not run them.