Now with charts and small sample sizes!
Alex Gordon struck out for the 14th straight game last night. Yes, he got his first home run of the year, added a single and yes, that was Jordan Zimmerman pitching who simply is not letting anyone have any fun with baseball bat this year.
A notorious slow starter and a streaky hitter always, Alex may simply be going through a rough patch. On Tuesday, I documented some of his other strikeout-heavy periods over the last five seasons, and while this particular run has surpassed anything in Gordon’s past, it is still not miles worse than some others. And, let’s not forget, Gordon has had some awful streaks in the midst of what turned out to be outstanding seasons.
Panic? No. Charts? Hell, yes. Small sample size warning? Consider it noted.
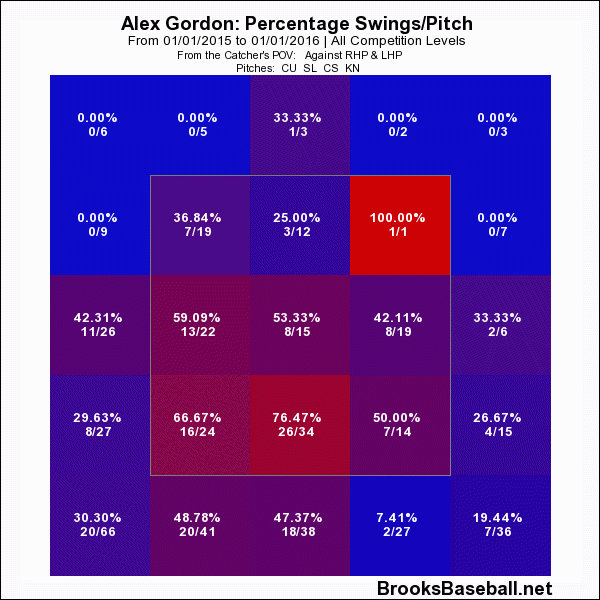
Let’s start by comparing Gordon’s swing rate from 2015 to 2016.
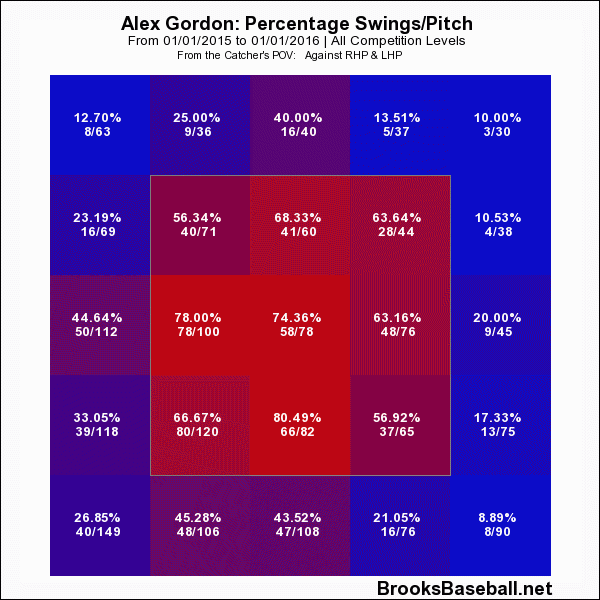
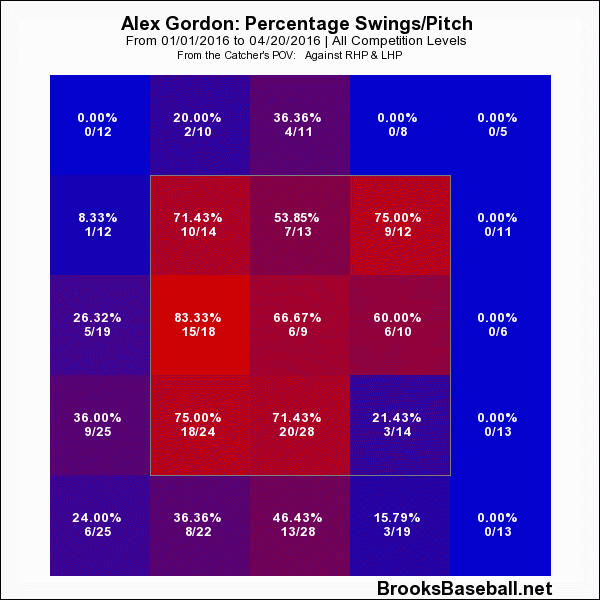
Early in 2016, Gordon is swinging at pitches outside and both low and high in the strike zone. He is disdaining the low inside portion of the zone, swinging at just 3 of 14 pitches in that quadrant in 2016 after offering at them 57% of the time in 2015. There is nothing super crazy going on here: no chasing an exorbitant number of pitches out of the zone – at least no more than Alex had done in the past.
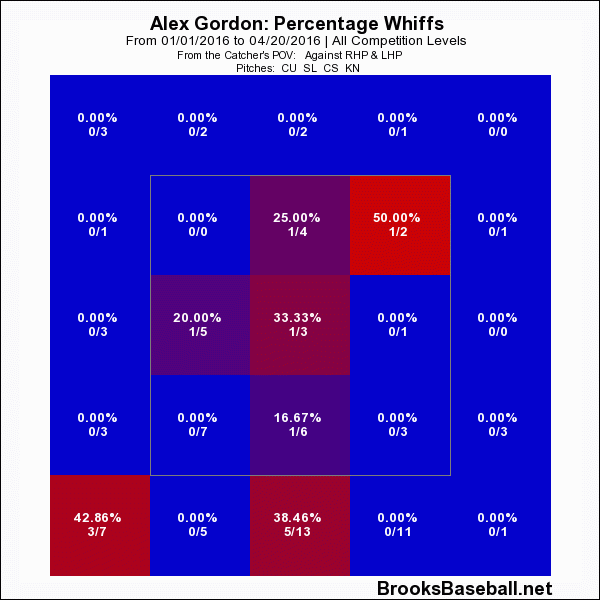
What about the dreaded swing and miss? Again, let’s compare 2015 to the early returns of 2016.
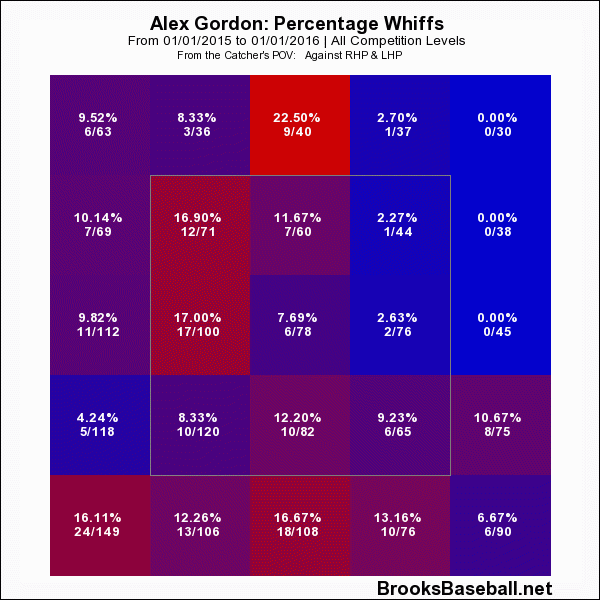
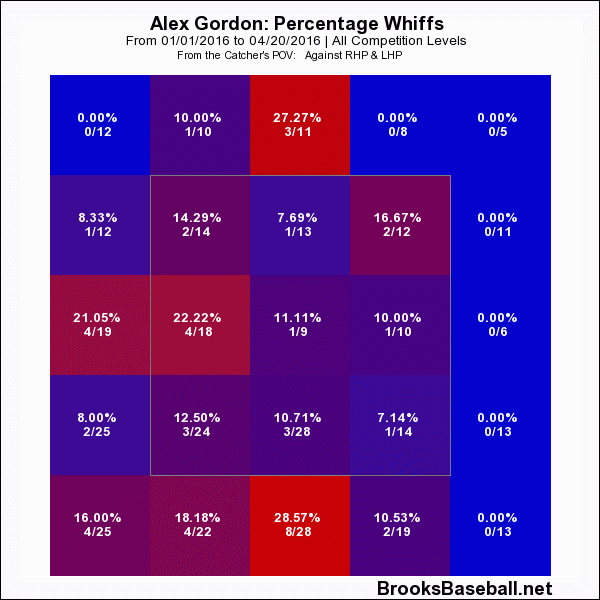
Well, what do we see here? A higher whiff rate middle-outside of the zone, as well as up and down over the middle in the zone. We can throw in middle-outside part of the strike zone, too. So, newsflash, a guy who is striking out a lot is swinging and missing more! Certainly not enough data to note a problem, but some quadrants to keep an eye on as we go slog forward.
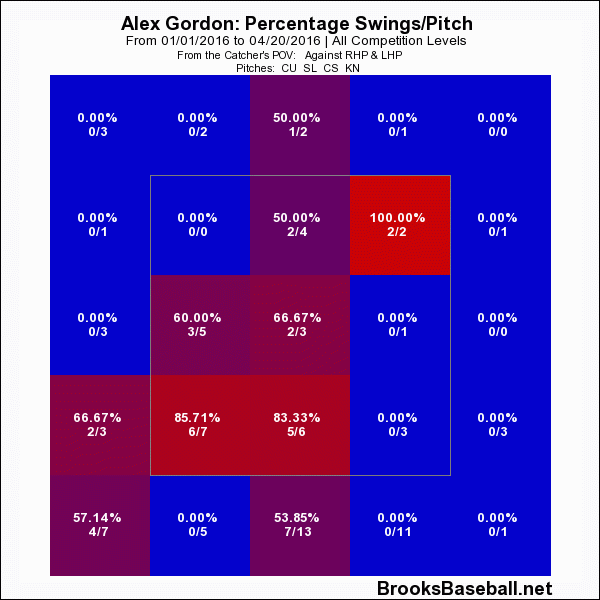
When Alex Gordon is struggling, we often look first and foremost at the breaking ball. Let’s check the swing rates against breaking balls.
And the whiff rates from 2015 and 2016 against those pitches.
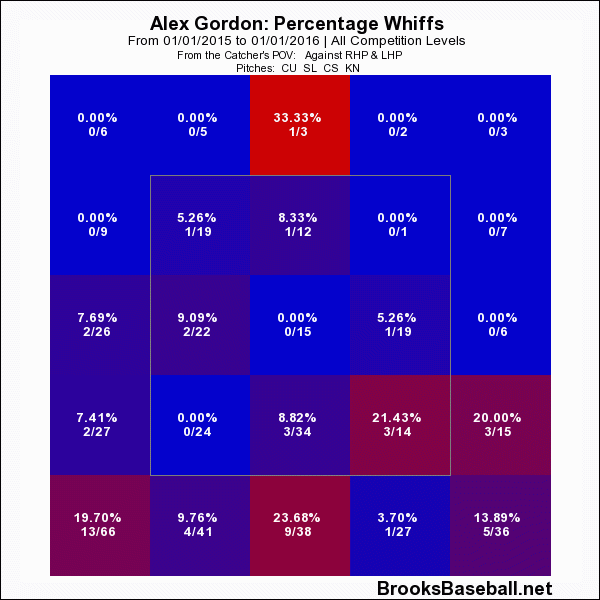
When we start boiling 13 games (these charts do not include Wednesday night’s game) down into just sliders and curves, there is barely enough data to even bother. However, if you wanted to, one could look at the swings and misses on breaking stuff out of the zone low and away.
Your eyes and mine have probably been telling you that without all the cool charts and, frankly, we have all seen Gordon go through stretches where the propensity to offer at and miss those very pitches. We have also seen Alex Gordon suddenly flip the switch and rake.
You know, a little bit like he did Wednesday night.