As you may recall from Tuesday’s recap, Ian Kennedy has a home run problem.
He’s allowed 18 dingers already this season. Ten of them have come in a barrage in his last four starts. If you’re sitting in the bleachers for a Kennedy start, bring a glove. Or a helmet. Safety first, you know.
Fun Home Run Fact #1: Of Kennedy’s 18 home runs, 11 of them have been solo shots. Seven of them have come with one runner on base.
It’s not difficult to see why the ball is leaving the yard with such urgency when Kennedy is on the mound. He’s giving up some truly hard hit balls. And his trends are alarming.
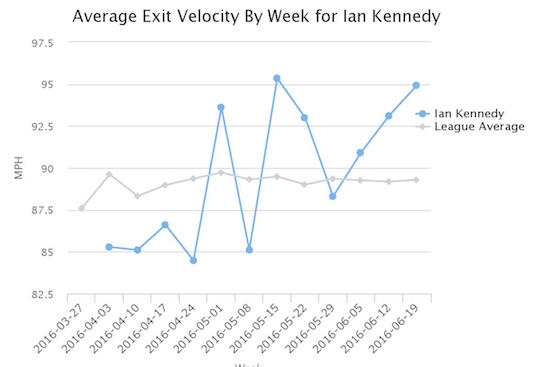
This graph from Baseball Savant makes all kinds of sense. His first four starts (covering the first four weeks of the graph), hitters had a difficult time barreling the ball. He kept the opposition’s collective exit velocity well below league average. The result? In 26 innings, he owned a 2.77 ERA with a 1.0 HR/9. Batters were hitting .220/.311/.341 against him. His average Game Score in those four starts was a robust 60. These were heady times.
The next 10 starts covering the next eight weeks? In only two of those weeks did he entice a below league average exit velocity. The big spike came in week number seven, which was after his May 12 appearance at Yankee Stadium. Fortunately, Kennedy was at the friendly confines of Kauffman Stadium against the Red Sox. At the time, no team blistered the ball more that the Sox. Kennedy allowed only two runs and one home run in the outing.
The takeaway from the above graph, instead of exact correlation, is how his average exit velocity has increased and remained well above average. In those eight weeks, he’s posted a 4.85 ERA with a 2.4 HR/9. Yes, a 2.4 HR/9. (I triple-checked the math, because yikes.) The opposition is hitting .244/.315/.479 off Kennedy in 55.2 innings.
Fun Home Run Fact #2: Kennedy has allowed 15 home runs on the road. Only three have been hit against him at Kauffman Stadium.
Hold my SABR award nomination. This isn’t exactly ground-breaking analysis. Yes, balls hit harder generally do more damage. So how about pitch type? Is there a particular pitch hitters are making a meal out of, maybe something Kennedy should avoid throwing? Here is the breakdown on home runs allowed by pitch type:
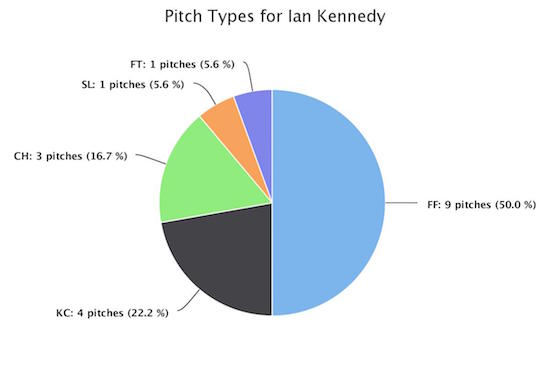
There’s nothing earth-shattering here. Kennedy throws a fastball 64 percent of the time. He shows his curve 14 percent and offers a change in 15 percent of his pitches. We’re probably right in line with what we can expect as far as home runs, all things being equal.
It should be noted Kennedy is a fly ball pitcher. A bit of a deeper dive reveals his fastball yields a fly ball over 35 percent of the time when it’s put in play. His fly ball rate is about the same at 33 percent on his curve. If a hitter lofts a change-up over the wall, they’ve done really well. That’s his ground ball pitch. His change results in a fly ball just 22 percent of the time when it’s put in play.
On our Baseball Prospectus leaderboards, we separate infield popups from fly balls. Kennedy’s 31 percent FB rate is the highest among qualified starters. (If you expand the bucket to 50 IP, Kennedy’s FB rate is the third-highest, behind Chris Young at 36 percent and Danny Duffy at 32 percent (ummm…the Royals allow a ton of fly balls). Home runs are going to happen with Kennedy on the mound because fly balls sometimes have enough distance to travel over the wall.
While a pitcher may be classified as an extreme fly ball pitcher, that pitcher’s HR/FB rate is largely out of his control with a league average HR/FB rate around 10 percent. Most pitchers live in the eight to 12 percent range and the sample size caveats apply here. A pitcher who has thrown more innings is expected to see his HR/FB rate normalize.
We can use this information to our advantage because Kennedy, as we know, has been an extremely reliable pitcher as far as innings go. He’s averaged 195 IP over the previous six seasons. There’s a bit of an alarming trend on his fly ball rate as it applies to home runs.
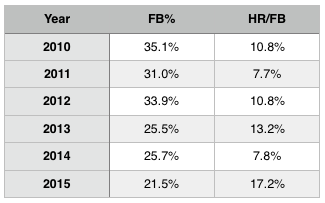
It’s safe to assume his massively elevated 17.2 percent HR/FB rate from 2015 is an outlier. Besides, that’s the smallest sample of the six, so we probably need to account for that. It’s also known Kennedy didn’t start the ’15 season off on the best foot – 12 of his 31 home runs came in his first eight starts. His HR/FB rate was dropping from the end of May onward.
What gets your attention is the overall increase of his HR/FB rate of the last three years while his FB rate was declining. In his return to the American League, the trend of his FB rate has reversed. As noted above, Kennedy currently owns a 31 percent FB rate. Even if his HR/FB rate normalized, we would still see an alarming number of home runs just because of the increase in fly balls. Yet his HR/FB rate hasn’t normalized. It’s currently sitting at 15.9 percent.
More fly balls. More home runs. More problems.
Fun Home Run Fact #3: Kennedy has allowed nine home runs to left-handed batters and nine home runs to hitters from the right side.
Again, this explains the problem. It doesn’t present a solution. And I’m not sure there is one.
Maybe it’s as simple as, “Stop throwing the ball down the middle of the plate!” That would be nice, if it were that easy, wouldn’t it? Here are the locations of the bombs Kennedy has allowed.
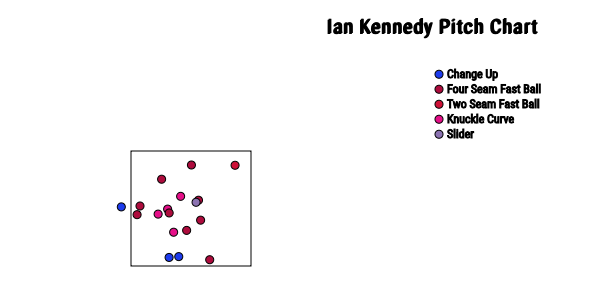
Meaty fastballs, hanging curves, and a slider that sat in the middle of the plate. I mean, it’s not difficult to see why those pitches were crushed.
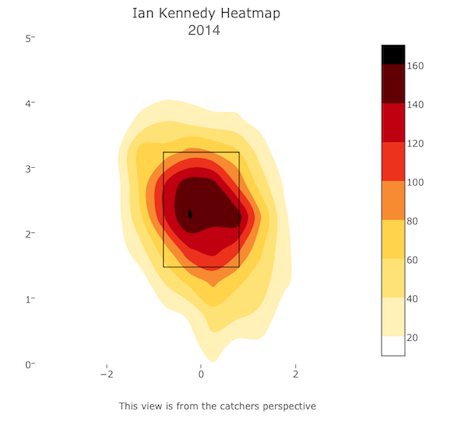
So is it location? Does he just serve too many tasty morsels middle-middle, just begging to be destroyed? I looked at his three most recent heat maps. First up, is Kennedy’s 2014 season where his home run rate was 0.7 HR/9 which was the best of his career.
 Kennedy has always caught a lot of the plate, but for perspective, we need to see his 2015 season where his home run rate more than doubled to 1.7 HR/9.
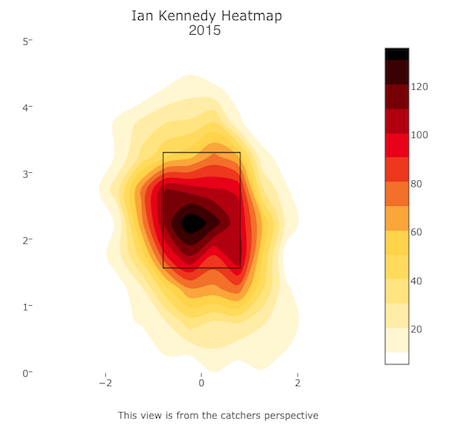 A much higher concentration of pitches found the hitter’s happy zone. And the heat map for this year?
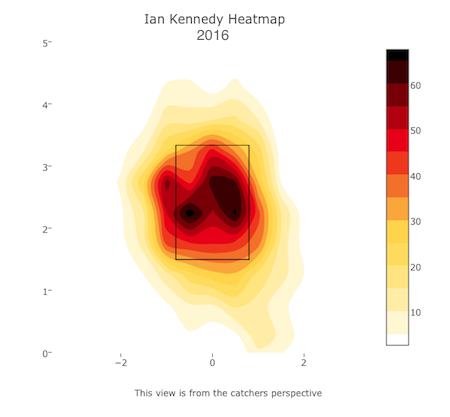 Again, a high concentration in the middle of the zone, but one that is much wider than 2015.
Now, let’s revisit those fastballs Kennedy has allowed for home runs. For the 2016 season, Kennedy’s average fastball has a velocity just a tick over 92 mph. His heater has a spin rate of 2385 rpm with a break angle of 35 degrees.
If we take the home runs he’s allowed on fastballs, we see it’s coming in at an average of 91.8 mph. These fastballs also have a spin rate of 2228 rpm with a break angle of 32 degrees.
It looks to me as though Kennedy is taking his foot off the gas at some point. The fastball has a little less hair on it and it comes in flatter than normal and when it catches too much of the zone, look out. Here are the home runs he’s allowed on fastballs this year and the pitch count.
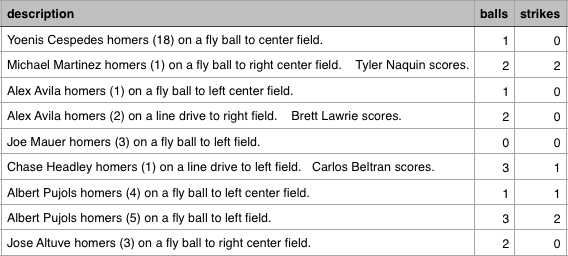
It seems that for most of his home runs allowed on a fastball, Kennedy is behind in the count and needing to throw a strike. As a result, he takes something off the pitch. Just enough that the edge tips to the hitter. And when he catches too much of the zone on said pitch… Blammo.
Is this the lone reason Kennedy is giving up so many bombs? Doubtful, but it seems like it’s valid theory. Kennedy’s batted ball profile means he’s always going to be susceptible to the home run. He’s going to keep giving up fly balls and some of those will have the distance to carry the fence. He just needs to find a way to minimize the damage that’s going to be inflicted.