Over the last couple seasons, Statcast has emerged to provide an additional lens with which you can view the game. For nerds like me (and possibly you since you’re reading this), it’s just a different element to evaluate a player and see if the eye test matches. I know I personally will be watching a game and think, “Man, that ball was absolutely smoked. How was it not a hit?” Then I’ll look it up and I can see it was a 102.9 MPH line drive with a hit probability of 77 percent. Yeah, that’s the good stuff.
As with anything, it’s a piece of the puzzle. You can’t evaluate a player or a team or even a single play with any one thing. Traditional scouting only tells you so much. Batting average only tells you so much. WARP only tells you so much. The more data points we can piece together allow us to get closer and closer to the whole story. With that in mind, I wanted to take a look at the Royals leaders in a few Statcast categories and see if it matches with what I’d expect from watching this team and if some of the other statistics match up with it.
All numbers in this article are using statistics through Tuesday’s game.
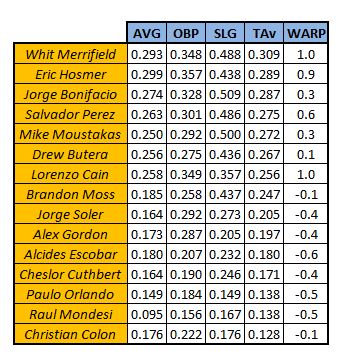
Here’s a look at the Royals stats:
The roster above is sorted by True Average (TAv), which is a tool designed to be a comprehensive look at the hitter’s contributions throughout the season. It’s basically on the scale of what you’d consider a good batting average to be, with a league average TAv always at .260, so you can see that the Royals actually have a few guys who have done well in that regard after a rough start.
Exit Velocity
| Player | Average Exit Velocity |
| Eric Hosmer | 90.4 MPH |
| Jorge Bonifacio | 90.0 |
| Salvador Perez | 89.5 |
| Brandon Moss | 88.9 |
| Drew Butera | 88.3 |
| Lorenzo Cain | 88.0 |
| Mike Moustakas | 87.4 |
| Jorge Soler | 87.4 |
| Whit Merrifield | 86.6 |
| Paulo Orlando | 86.6 |
| Alex Gordon | 85.9 |
| Cheslor Cuthbert | 85.8 |
| Alcides Escobar | 83.0 |
| Christian Colon | 80.2 |
| Raul Mondesi | 77.4 |
| Team Total | 87.3 |
This is a simple one to understand. It’s how hard the ball is hit. Hitting the ball hard is good. Hitting the ball soft is usually bad, but if you place it right, it can be good. But still, hit the ball hard, kids.
The three names at the top aren’t surprising, but Moss at fourth is sort of is given how much weak contact he seems to make. I guess the booming home runs have boosted that total. I’m a little surprised that Lorenzo Cain is near the top of the list as well as it seems like he’s making an awful lot of weak contact. To me, I think the most interesting name on this list is Merrifield, leading the Royals in TAv, but averaging the same exit velocity as Orlando, who was so bad, he had to be demoted to the minors.
Launch Angle
| Player | Average Launch Angle |
| Salvador Perez | 22.2° |
| Jorge Soler | 22.0° |
| Paulo Orlando | 18.5° |
| Mike Moustakas | 17.8° |
| Drew Butera | 16.1° |
| Brandon Moss | 16.0° |
| Jorge Bonifacio | 14.1° |
| Alcides Escobar | 13.8° |
| Whit Merrifield | 12.9° |
| Lorenzo Cain | 10.3° |
| Cheslor Cuthbert | 9.0° |
| Alex Gordon | 7.6° |
| Christian Colon | 2.4° |
| Eric Hosmer | 2.1° |
| Raul Mondesi | -0.2° |
| Team Total | 12.6° |
Launch angle isn’t as much of an indicator of success as exit velocity, so it’s not necessarily a surprise some of these names are in a different order than you’d probably expect. Perez at the top makes sense, as does Soler with how many popups he’s hit in his short time back with the team. The biggest surprise to me is Paulo Orlando sitting at third on the team. He’s in fly ball territory with that average launch angle and he doesn’t have enough power to live there. I’ll note Hosmer toward the bottom, but we knew that would be the case. And no, Mondesi’s negative launch angle is not a typo.
Barrels
| Player | Barrels | % Pitches |
| Brandon Moss | 12 | 2.2% |
| Mike Moustakas | 16 | 2.1% |
| Jorge Bonifacio | 9 | 2.0% |
| Salvador Perez | 14 | 2.0% |
| Eric Hosmer | 14 | 1.8% |
| Whit Merrifield | 8 | 1.5% |
| Raul Mondesi | 2 | 1.2% |
| Cheslor Cuthbert | 2 | 0.9% |
| Jorge Soler | 2 | 0.7% |
| Alcides Escobar | 4 | 0.5% |
| Alex Gordon | 3 | 0.4% |
| Lorenzo Cain | 3 | 0.4% |
| Drew Butera | 0 | 0.0% |
| Paulo Orlando | 0 | 0.0% |
| Christian Colon | 0 | 0.0% |
| Team Total | 89 | 1.3% |
According to mlb.com, a barrel is defined as a well-struck ball where the combination of exit velocity and launch angle generally leads to a minimum .500 batting average and 1.500 slugging percentage. Typically, a barrel is a ball hit at least 98 MPH and with a launch angle between 26° and 30°. To make it easier, a barrel is a good thing.
It’s no surprise that the top of the Royals leaderboards for this are mostly their home run leaders, but what’s striking is how big the dropoff is from Merrifield with eight to Escobar with four. What’s even more striking is that Cain only has three barrels all season long. Some of his newfound plate discipline has masked the fact that he hasn’t been especially good when actually swinging the bat to this point in the season. I’m a little surprised Butera doesn’t yet have a barrel, because it seems like he’s stung the ball pretty well a couple times this year.
Hit Distance
| Player | Average Hit Distance |
| Salvador Perez | 226.2 feet |
| Drew Butera | 214.7 |
| Jorge Bonifacio | 206.4 |
| Mike Moustakas | 205.4 |
| Brandon Moss | 204.9 |
| Whit Merrifield | 197.4 |
| Paulo Orlando | 192.4 |
| Raul Mondesi | 183.3 |
| Cheslor Cuthbert | 180.0 |
| Alcides Escobar | 178.4 |
| Jorge Soler | 177.5 |
| Lorenzo Cain | 171.1 |
| Eric Hosmer | 159.9 |
| Alex Gordon | 158.2 |
| Christian Colon | 154.0 |
| Team Total | 188.2 |
The top six names on this list are also the Royals top six in ISO (isolated slugging percentage – slugging percentage minus batting average), so that probably comes as no surprise. Then comes Orlando who didn’t collect an extra base hit in 50 plate appearances and Mondesi, who wasn’t exactly flashing big power on the regular. Then it starts to make some sense. We see here what an impact ground balls can have on your average distance with Hosmer and Gordon near the bottom of the team leaderboards, but Hosmer makes up for it when he doesn’t hit the ball on the ground. Gordon, well, doesn’t make up for it.
Swing Speed
| Player | Average Swing Speed |
| Eric Hosmer | 62.4 MPH |
| Jorge Bonifacio | 61.9 |
| Salvador Perez | 61.5 |
| Brandon Moss | 60.9 |
| Drew Butera | 60.7 |
| Lorenzo Cain | 60.3 |
| Mike Moustakas | 59.9 |
| Whit Merrifield | 59.3 |
| Jorge Soler | 59.1 |
| Paulo Orlando | 58.9 |
| Alex Gordon | 58.3 |
| Cheslor Cuthbert | 57.9 |
| Alcides Escobar | 55.9 |
| Raul Mondesi | 53.5 |
| Christian Colon | 53.0 |
Swing speed is an estimated stat that isn’t great just yet because it can only be estimated based on exit velocity and pitch speed. That means there’s no data for when the batter swings and misses because there’s no exit velocity. I don’t think the list is any surprise, partially because I mentioned it when talking about Gordon’s struggles recently. It’s really striking how slowly Escobar, Mondesi and Colon swung the bat this season. I’m also a little surprised to see Soler so low because it sure seems like he swings awfully hard. While this one doesn’t mean a ton, at least not yet, it’s still interesting to see.
Rankings
Finally, I decided to take the five categories above and rank them with the player at the top getting 15 points and the player at the bottom getting 1 point. Here’s how that looked:
| Exit Velocity | Launch Angle | Barrel % | Hit Distance | Swing Speed | Total | |
| Perez | 13 | 15 | 12 | 15 | 13 | 68 |
| Bonifacio | 14 | 9 | 13 | 13 | 14 | 63 |
| Moss | 12 | 10 | 15 | 11 | 12 | 60 |
| Moustakas | 9 | 12 | 14 | 12 | 9 | 56 |
| Butera | 11 | 11 | 3 | 14 | 11 | 50 |
| Hosmer | 15 | 2 | 11 | 3 | 15 | 46 |
| Merrifield | 7 | 7 | 10 | 10 | 8 | 42 |
| Soler | 8 | 14 | 7 | 5 | 7 | 41 |
| Orlando | 6 | 13 | 2 | 9 | 6 | 36 |
| Cain | 10 | 6 | 4 | 4 | 10 | 34 |
| Cuthbert | 4 | 5 | 8 | 7 | 4 | 28 |
| Escobar | 3 | 8 | 6 | 6 | 3 | 26 |
| Gordon | 5 | 4 | 5 | 2 | 5 | 21 |
| Mondesi | 1 | 1 | 9 | 8 | 2 | 21 |
| Colon | 2 | 3 | 1 | 1 | 1 | 8 |
I honestly wasn’t sure how this would turn out when I started, but it’s actually not a bad look at who’s done well for the Royals and who has done poorly, though maybe in a bit of a weird order. Obviously I’m only looking at batted ball data here, so things like Cain’s plate discipline don’t show up, but it’s interesting to dig into some extra data to see where these numbers match up with some of the other numbers we look at on a regular basis.
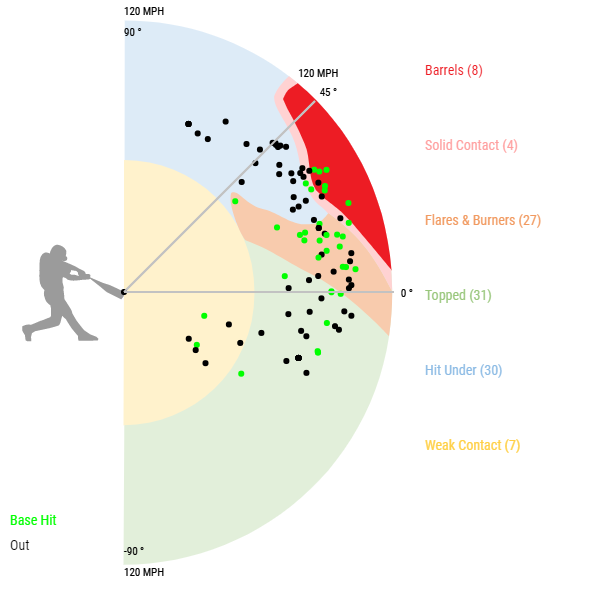
Feature Image: Whit Merrifield’s Radial Chart from baseballsavant.mlb.com

