Let’s get one thing out of the way right up front. Alex Gordon was one of the 10 best players in baseball from 2011 to 2014. This is not hyperbole. This is fact.
| Year | Age | G | PA | AB | R | H | 2B | 3B | HR | RBI | SB | CS | BB | SO | BA | OBP | SLG | OPS | OPS+ | TB | HBP | Awards |
|---|---|---|---|---|---|---|---|---|---|---|---|---|---|---|---|---|---|---|---|---|---|---|
| 2011 | 27 | 151 | 690 | 611 | 101 | 185 | 45 | 4 | 23 | 87 | 17 | 8 | 67 | 139 | .303 | .376 | .502 | .879 | 140 | 307 | 7 | MVP-21,GG |
| 2012 | 28 | 161 | 721 | 642 | 93 | 189 | 51 | 5 | 14 | 72 | 10 | 5 | 73 | 140 | .294 | .368 | .455 | .822 | 123 | 292 | 3 | GG |
| 2013 | 29 | 156 | 700 | 633 | 90 | 168 | 27 | 6 | 20 | 81 | 11 | 3 | 52 | 141 | .265 | .327 | .422 | .749 | 103 | 267 | 9 | AS,GG |
| 2014 | 30 | 156 | 643 | 563 | 87 | 150 | 34 | 1 | 19 | 74 | 12 | 3 | 65 | 126 | .266 | .351 | .432 | .783 | 118 | 243 | 11 | AS,MVP-12,GG |
The quality of play coincided with his shift from third base to left field. Freed from the hot corner, Gordon blossomed into an all around force on the diamond. It’s probably not a coincidence that his best seasons came from age 27 to 30, the normal prime for most baseball players. Nor is it a coincidence that he played those seasons largely injury free, averaging 156 games a year.
Sure, the numbers began a decline in 2013, but he was able to shove back with a better season in 2014. Through all this, the defense remained consistent and top notch. It’s difficult to frame a season or a stretch of a career through subjective awards, but the accolades were impressive in those four years. Four Gold Gloves, two All-Star games and two years where he collected down ballot consideration for the MVP award. (And in both those seasons you could justify a better finish in the balloting.) Overall, Gordon was worth 22.7 WARP, an average of 5.7 WARP a season.
The 2015 season saw Gordon miss time due to a groin injury suffered going back on a fly ball in left. The following year he fractured his wrist in a collision that took Mike Moustakas out for the season. He appeared in 132 games in the two seasons and saw his offensive production decline.
Then came 2017.
Healthy, he played in 148 games. The offensive production, however, was abysmal. Beyond abysmal, actually.
His final line was .208/.293/.315 and a .233 TAv. Let’s reflect on those for just a moment. The batting average was 50 points below his career average and nearly 100 points off his career best. His OBP was almost 50 points below his career average and nearly 85 points off his career high. And his slugging was over 100 points below his career average and nearly 200 points off his career high.
What a fall.
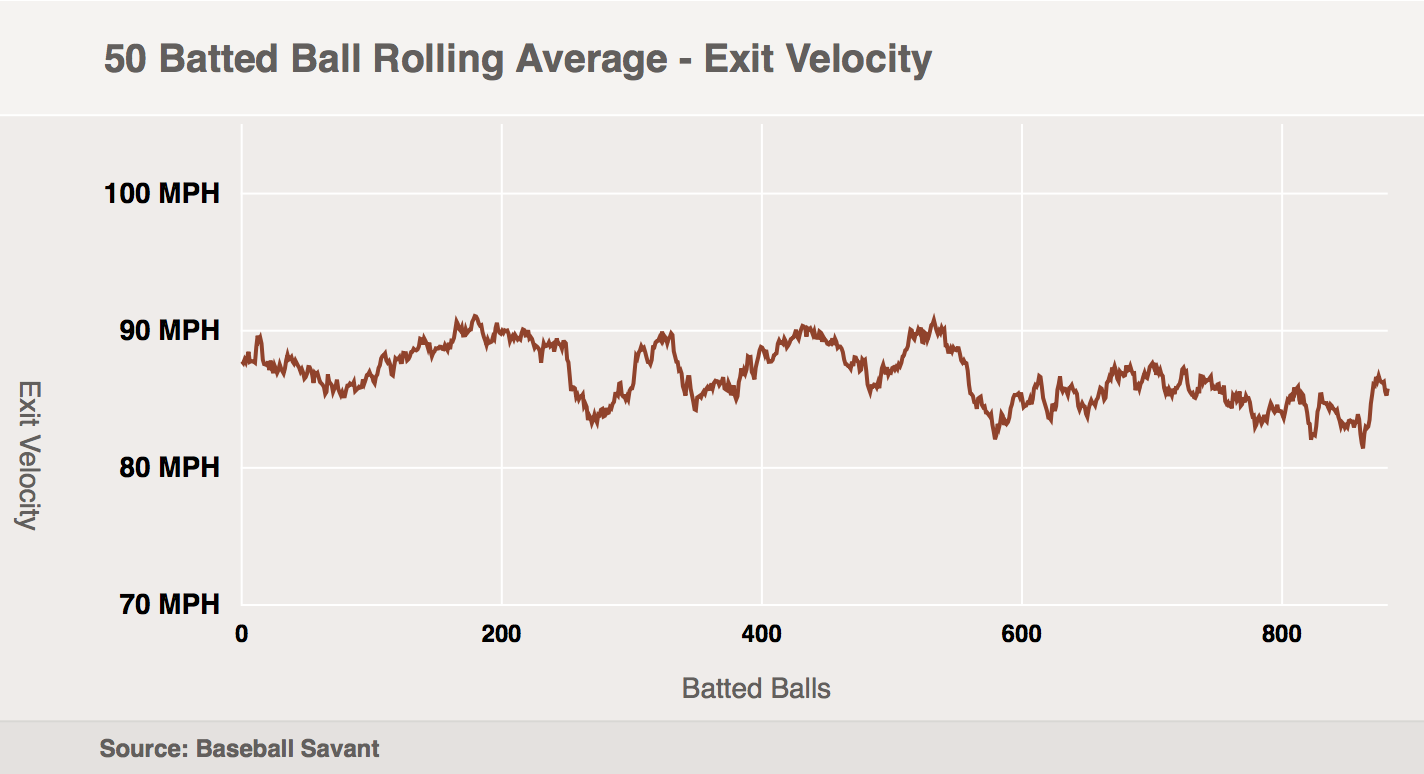
The easiest analysis of what happened to Gordon is that this is a player entering the decline phase of his career and having it accelerated by injuries. Some of the underlying metrics bear this out. Take, for example, his average exit velocity. Tracked since 2015, he’s been around league average for the most part. Except for last year. The numbers below are provided by Statcast.
2015 – 88.1 mph
2016 – 87.9 mph
2017 – 85.8 mph
Statcast has a nice visual breakdown of his rolling exit velocity of the last three years.
Gordon made less hard contact last year than at any time since his breakout campaign. Again, from Statcast, this is a visual representation of his batted ball type. First, from the 2015 season:
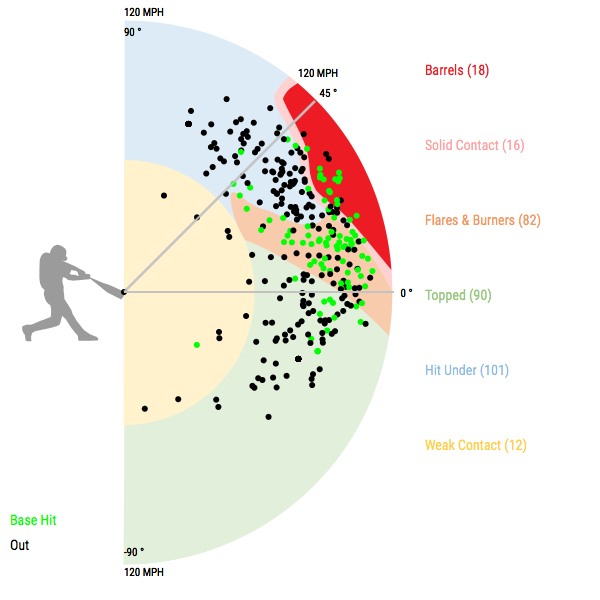
Compare that to 2017:
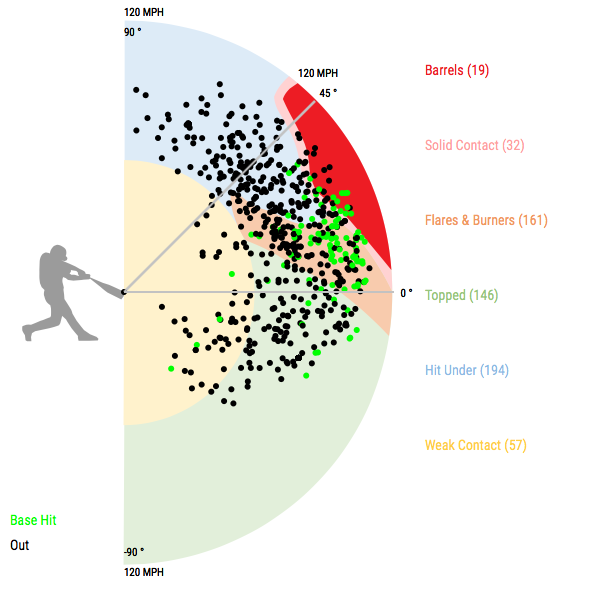
You obviously see fewer plots in the ’15 chart due to opportunity. But the ratios are largely there, except for the two most extreme categories, Barrels and Weak Contact. While his Barrels remained static, his Weak Contact increased almost five-fold. Also, his Flare & Burner category was more “Flare,” meaning a little lower on the exit velocity spectrum, than “Burner.” Overall, there’s a lot less exit velocity, but you already knew that because of the averages presented above.
This isn’t exactly revelatory. If you’ve followed Gordon for any extended period of time, you’ve surely noticed that he’s not hitting the ball with the same kind of authority as the past. But is there anything that would suggest he could turn it around? Not exactly get back to his peak from 2011, because that’s long in the past. Nor even the start of his decline phase, as that seems wishful thinking at this point as well. Can he just be a league average offensive performer at any point in the next two seasons?
It doesn’t seem likely.
The bat speed is gone and that’s not something that is going to come back. His downward arc on BABIP is true because as we’ve seen, he’s lost precious exit velocity. His strikeout rate is a tad higher than you’d like to see, but he should really focus on elevating the walk rate. Last year, it was 8.3 percent, which is well below his career average and the first time in four years he wasn’t above 10 percent. At least that would help nudge his OPB back above .300.
Remember back to the World Series when Ned Yost was hitting Alex Gordon in the eighth spot. At the time, it was an absurd lineup construction with some taking the opportunity to point out that Gordon wasn’t a quality offensive performer. Sadly, after the 2017 season, that seems prophetic. Even on a team with a weak offensive projection, Gordon’s bat profiles as an eighth or ninth place hitter. It’s difficult to imagine him rediscovering any kind of offensive mojo to justify him hitting any higher in the order.
The good news is, the glove still plays. Last summer, Gordon was worth three outs above average in left. That may not sound like much, but it was equal to Brett Gardner, generally considered one of the top left fielders in the game, along with Gordon. According to the Fielding Bible, he was worth 9 defensive runs saved, which was tied for second best in the AL behind Gardner’s 17.

Gordon is very good at going back on balls hit over his starting position. He could do a little better moving in on the ball. Still, thanks to good health, it was his best year with the glove since 2014.
With the defense declining at a slower rate than the offense, there is still a role to be had for Gordon. Unfortunately, he needs to be hidden or protected in the lineup, which means he needs quality bats to cover for his offensive shortcomings. The Royals won’t have those bats for this season, or the next when Gordon plays out the final year of his contract.
Signed to a four-year, $72 million deal that was the largest in club history, Gordon has dealt such a massive negative value in his first two years, there is virtually no way the Royals are going to recoup the contract. He’s set to earn $20 million in each of the next two seasons and the best the Royals can hope for is a WARP approaching 2. It was probably a bit of an overpay at the time, but the acceleration of his decline phase has made this a fiscal albatross. It’s a cautionary tale of both playing the free agent market and falling for a player the team knows all too well. As the Hot Stove struggles to stay lit, you wonder if the Royals will heed this lesson over the next couple of months.
The thing I liked most about Gordon last year was that he still took his walks (noticeable on a team filled with players who didn’t). If he can hit .250 and continue to walk rate he might be the best player to hit 2nd on a team.