Earlier this week, our own Darin Watson pointed out how well the Royals rotation has pitched within the confines of Kauffman Stadium, along with how dreadfully they’ve pitched when leaving Kansas City. If you haven’t already read it, you should definitely click the above link and check out the numbers. If you have read it, you should still click the link to familiarize yourself with the numbers once more. You know you want to.
Darin’s terrific article led me down a path to try and figure out why the pitchers have turned into pumpkins away from the K. Consider the following analysis a continuation to Darin’s work. If his post was a seven-inning, one-run start, this can be an appearance by Kelvin Herrera. Well, I don’t want to set the bar too high. How about Scott Alexander?
Because Danny Duffy has been the rare starter to perform worse at home, we’ll solely focus on the four starters whose numbers take a nosedive when the team leaves Missouri. The first thing I wanted to look at was each pitcher’s pitch usage to see if anything was drastically different. We’ll start with Edinson Volquez.
| Volquez | FB | SI | CH | CB |
| Home | 2.7% | 52.4% | 20.2% | 24.7% |
| Away | 2.1% | 47.6% | 23.6% | 26.7% |
Volquez has gone away from his sinker in favor of more changeups and curveballs on the road, which is interesting to me, because hitters have not done as much damage against those secondary pitches, hitting .228 and .224 against them, respectively. It seems like this is the right idea for Volquez, but it clearly has not worked out. Could this just be a case of bad luck? After all, his road BABIP is .311, compared to a home BABIP of .280, and that doesn’t even account for home runs. As much as I’d love that to be the case, there’s another factor at play: poor command.
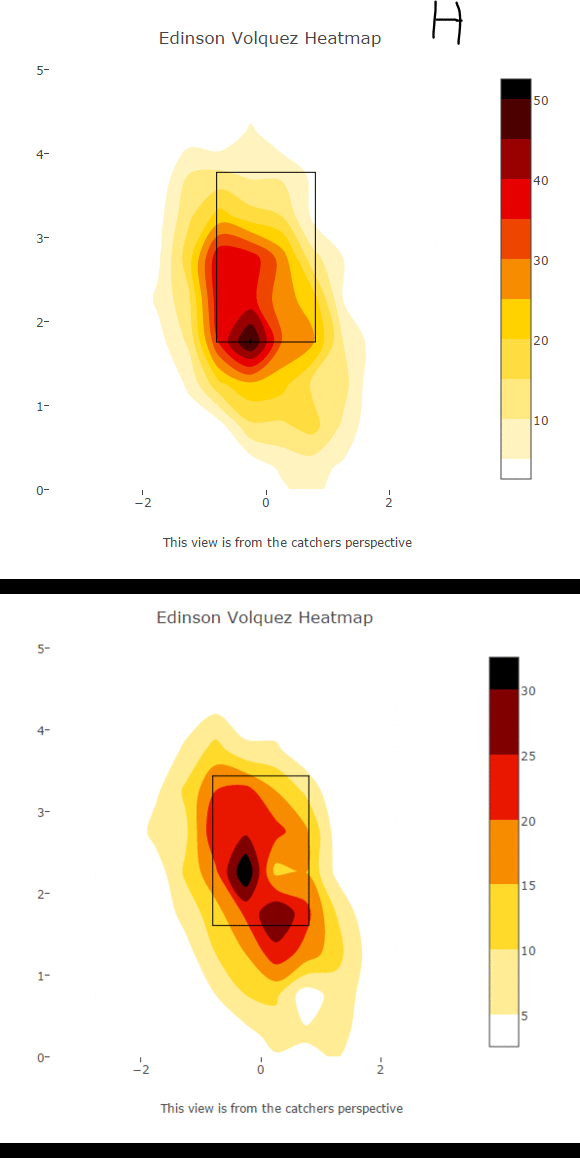
Take a look at Volquez’s pitch locations for his home and road starts. (The heat map for his home starts has a poorly-drawn “H” at the top.)
You can probably see the problem. At Kauffman, Volquez has kept the ball down at the bottom of the zone. On the road, he’s left several pitches in the middle of the plate, and that’s come back to bite him.
Next, let’s take a look at Ian Kennedy.
| Kennedy | FB | CH | CB | CT |
| Home | 65.5% | 16.8% | 14.6% | 3.1% |
| Away | 62.9% | 14.3% | 14.1% | 8.7% |
The biggest difference for Kennedy has been slightly fewer fastballs and changeups away from home, opting instead for more cutters. His fastball has easily been his best pitch this year, although he has surrendered nine dingers with it. Because the heater is such a flyball-inducing pitch, he may be going away from it in smaller parks in an attempt to limit the damage. Unfortunately, his secondary pitches haven’t been as sharp, with only his changeup keeping opponents under a .580 slugging percentage.
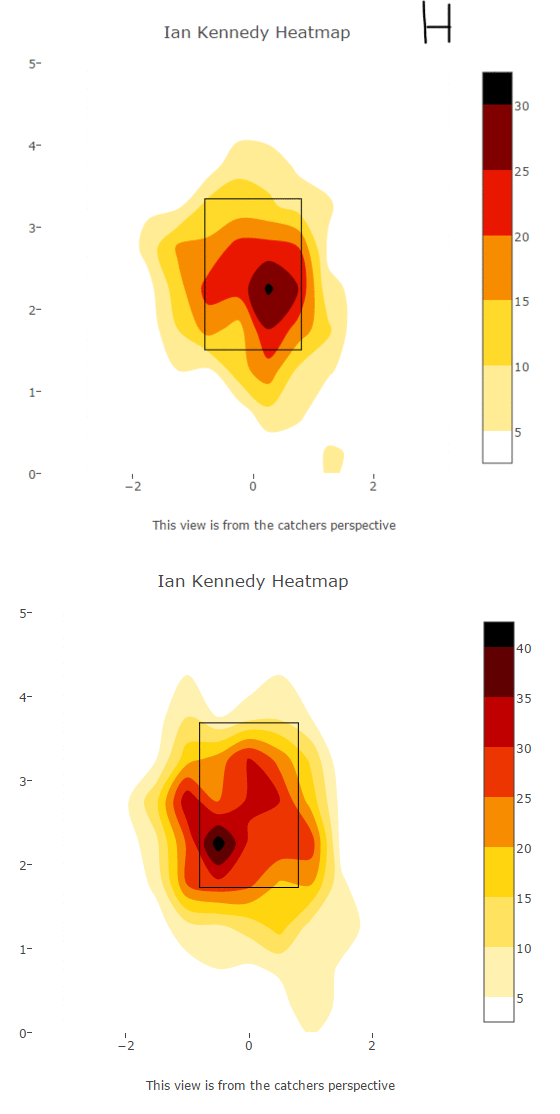
Like Volquez, Kennedy’s pitch location has varied based on the park location.
It looks like Kennedy has been working different sides of the plate for home and road games, and that likely has something to do with the batters he’s faced. On the road, Kennedy has been at a platoon disadvantage against nearly 55 percent of the batters he’s faced. When pitching at Kauffman, he’s only faced lefties 44 percent of the time. While righties have still been good against him away from home, his regular platoon split has been magnified.
His pitch location on the road shows a few more pitches up and over the middle, which isn’t an area a pitcher should attack too often. It’s also possible that the specific ballparks have been a problem, as seven of the thirteen homers allowed by Kennedy on the road have been hit in U.S. Cellular Field and Yankee Stadium.
Next up, it’s Yordano Ventura.
| Ventura | FB | SI | CH | CB |
| Home | 46.0% | 12.4% | 17.9% | 23.7% |
| Away | 40.8% | 16.0% | 18.0% | 25.2% |
As it was with Kennedy, Ventura’s gone away from his four-seamer when he goes away from home. He’s leaned more on his sinker, and mixed in a few more curveballs as well. Opponents have been crushing Ventura’s fastball this year, so just like Volquez, this strategy makes all kinds of sense. Unfortunately, it hasn’t paid off.
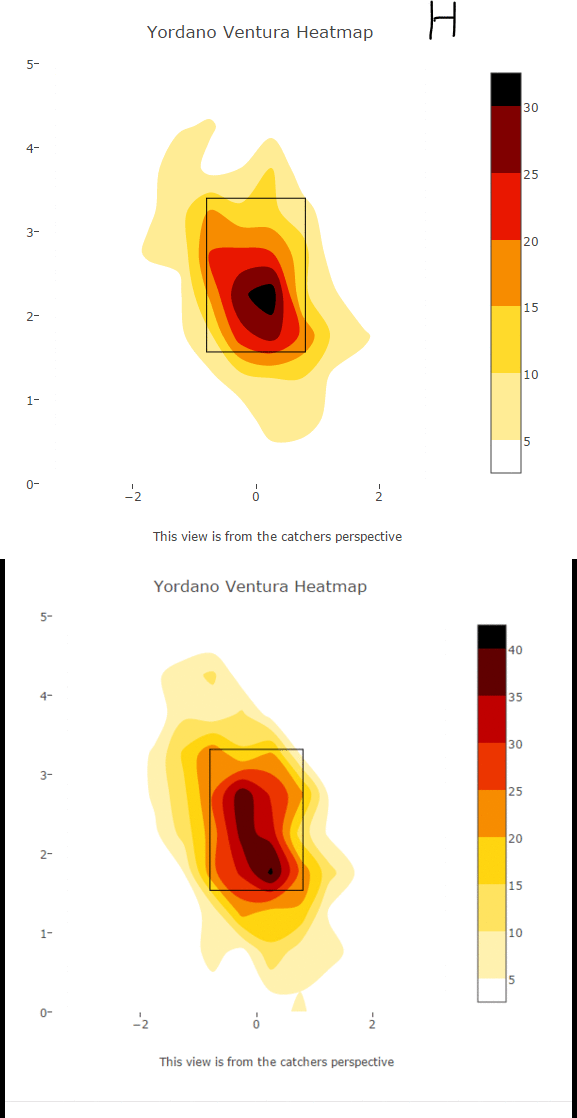
Ventura doesn’t have as much of a BABIP difference as Volquez, and his platoon split isn’t as drastic as Kennedy’s, so let’s look at his pitch location to try and find an answer.
The differences here aren’t terribly significant, but he has left a few more pitches up in the zone when hitting the road – which has led to more dingers – but the biggest problem seems to simply be his control. He’s walked 12.2 percent of the batters he’s faced away from the K, while limiting it to 9.3 percent at home. Granted, he has walked just 4.1 percent of the batters he’s faced in his last three starts (all on the road) so perhaps he’s turning things around.
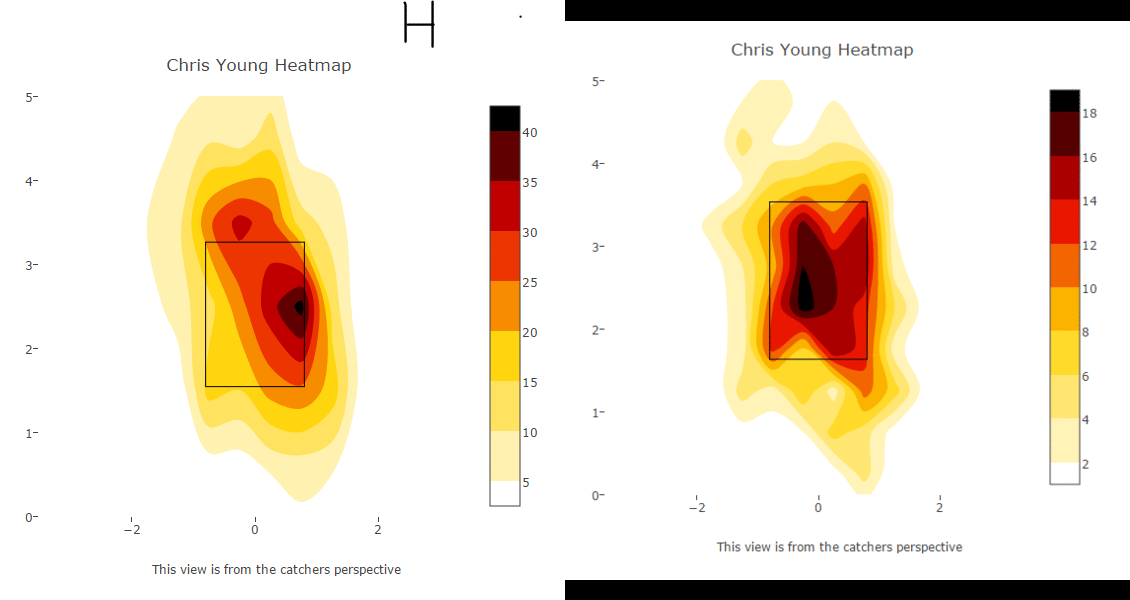
Finally, we’ll turn our attention to the most extreme home/away split of the bunch, which belongs to Chris Young.
| Young | FB | SL | CH | CB |
| Home | 50.3% | 49.4% | 0.2% | 0.0% |
| Road | 42.3% | 56.2% | 1.0% | 0.5% |
Once again, we see a pitcher making a completely logical adjustment. Young is always going to give up home runs with his fastball, so when he’s not in a park that suppresses home runs, he’s throwing fewer fastballs. However, his command of the fastball, as well as his slider, has not been sharp on the road.
When he’s in Kauffman Stadium, Young is keeping his fastball above the zone, and his slider to his glove-side. When he’s not in Kauffman Stadium, Young is filling up the middle of the strike zone with both pitches, which is good if you’re a batter facing him. With his repertoire, the margin for error is already small, and missing his location that badly has led to downright frightful results.
Also contributing to Young’s split is a similar issue to Kennedy, in that he’s faced more lefties on the road. About 55 percent of the batters Young has faced away from home have been left-handed, compared to 42 percent at home. On the road, those left-handed batters have a .392/.456/1.100 line, in 57 plate appearances, with 10 home runs. That’s a 1.100 slugging percentage. And 17.5 percent of those plate appearances have ended with a dinger. Add in the doubles and triples, and Young has allowed an extra-base hit to almost 23 percent of the lefties he’s faced on the road. To provide some terrifying perspective: In 1921, Babe Ruth collected 119 extra-base hits, setting a record that has yet to be broken. His extra-base hit rate that year? 17.1 percent.
Young’s road issues are almost indescribable. It’s kind of impressive to think about, to be honest.
Putting it all together, you can see a few things. First, the pitchers’ command simply has to be better on the road. Whether the different mounds are causing their mechanics to go out of whack, or if there are mechanical issues that have coincidentally appeared away from home, or if it’s something else entirely, the Royals rotation has not been able to keep the ball out of the middle of the plate nearly enough.
There are some platoon problems as well, namely for the two flyball guys, but that should even out as time goes on, helping to regress the unsightly numbers to a more palatable mean. Of course, that’s only if the command improves.
It does look like the pitching staff is adapting their approach and pitch mix to different stadiums, which is a positive, but again, it’s only going to help them if they’re putting pitches in the right areas of the zone. A poorly-placed sinker can leave the park just as quickly as a belt-high four-seamer.
Basically, it all boils down to command. Some of these pitchers have absolutely dominating stuff at times, but when they miss spots, hitters can do – and have done – a lot of damage. The only way to limit that damage is to get their command under control.
1 comment on “Digging Deeper into the Royals’ Road Woes”
Comments are closed.