An off day in a lost season means it’s time to scramble for something interesting to write. The 2016 edition of the Royals has been sometimes thrilling, often frustrating and overall just kind of vanilla. The K is still packed and there is a buzz on nights when the Royals are performing.
So maybe this is the start of a series. Maybe this is just a one time thing. Doesn’t matter. You can still read and (hopefully) enjoy. Today, we’ll cover 0-5. Well, leave a little wriggle room on both sides of that spread. Perhaps next week will be 6-10. It’s like an adventure.
Onward.
-1 – The total number of Defensive Runs Saved when the Royals deploy the shift. Scoff all you want at defensive metrics, but the Royals use the shift among the fewest times of all teams, but when they do, they can’t seem to get it right. They and the Miami Marlins are the only teams in baseball with a negative Runs Saved when shifting.
The Royals have rightfully earned kudos for expanding their analytics department the last several seasons, but I’m wondering why they aren’t using the defensive data more to their advantage. Do they think their defense is simply that great that they don’t need to shift like other teams? That seems like a very Royals thing to do.
0 – The Royals have been shutout nine times this year. It feels like it’s happened more often, doesn’t it? In their run to the championship last season, they were blanked 11 times. In 2014, that number was just seven. Honestly, you may not have been aware of the numbers behind the shutouts, but you know this has been an issue this year.
To make matters seem a little worse, in their last two shutout losses, the Royals have allowed 25 runs.
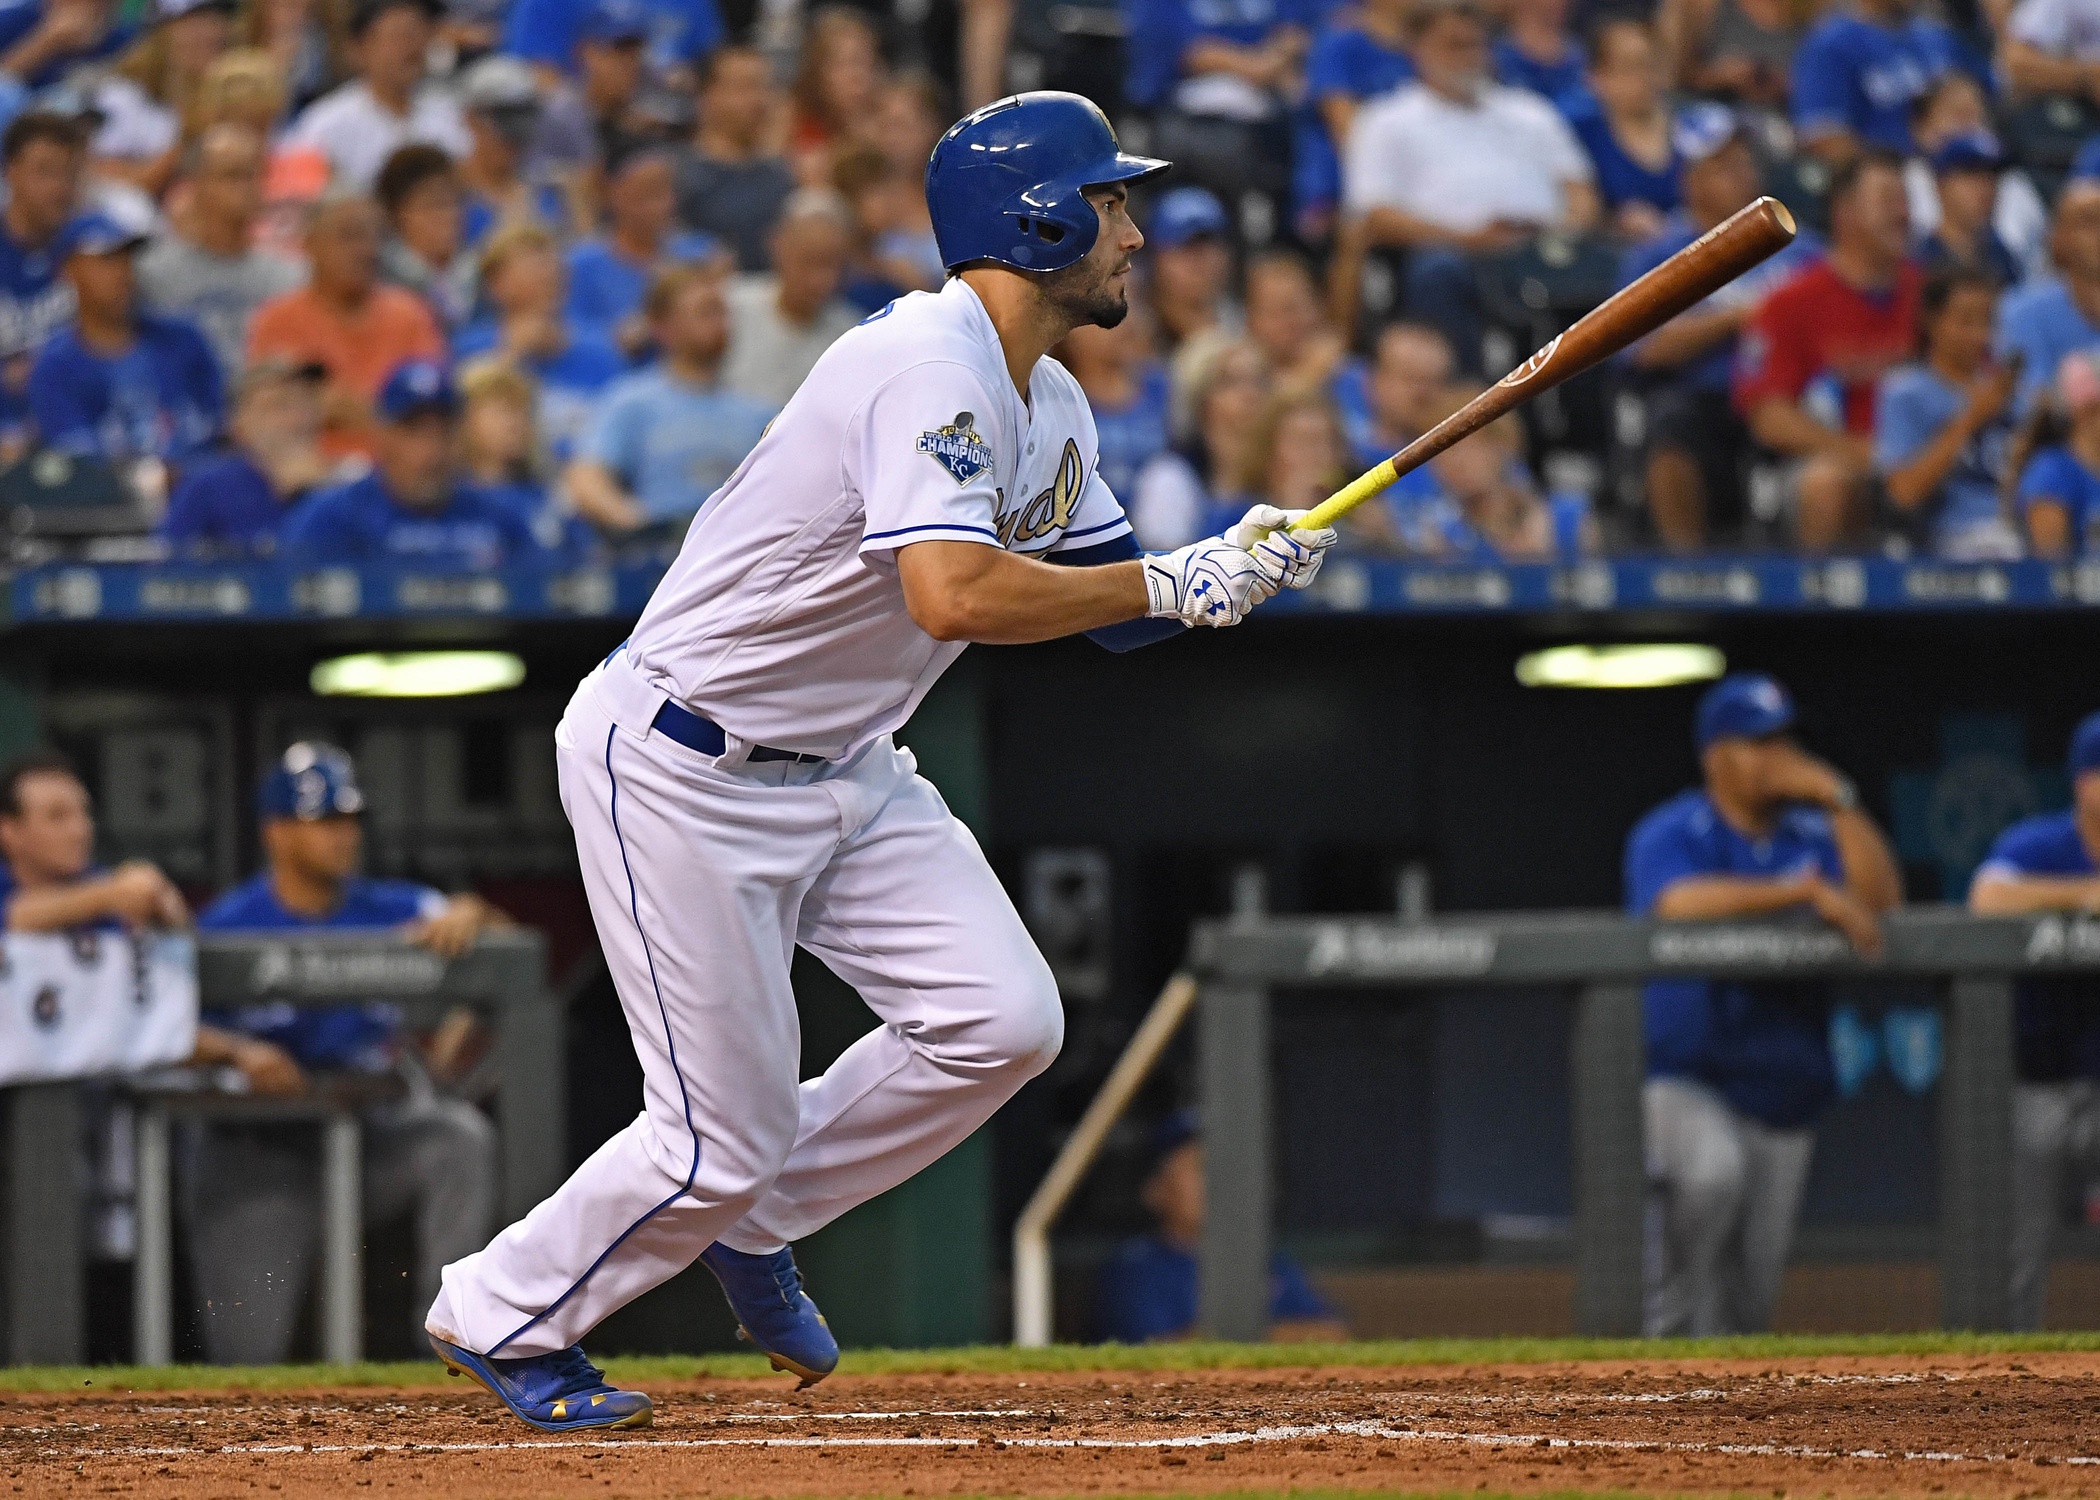
1 – Whit Merrifield has made one productive out this year in 41 opportunities. We kid about the Royals and how they really seem to enjoy those productive outs, but maybe there’s something to that. Baseball Reference measures productive outs as advancing a runner with no one out, or bringing home a run with the second run of an inning. Simple criteria. Merrifield was woefully unproductive with his outs. He had 25 opportunities to do something somewhat positive while making an out, but cashing in only one of those means he has a four percent productive out rate. League average is 30 percent.
2 – Would you like proof that Danny Duffy is a different pitcher? Look no further than his 2.0 BB/9 which is the best rate of his career. Granted, some of that has come from throwing out of the bullpen, but his walk rate as a reliever was a touch higher at 2.5 BB/9. As a starter, it’s been 1.8 BB/9. There’s been plenty of discussion among Royals officials that the lefty has found some confidence in his command, and that’s definitely been the case. The Duff Man has stopped nibbling and gone on the attack. The results have been about the only positive to come out of the Royals rotation this summer.
3.33 – Paulo Orlando sees the fewest pitches per plate appearance than any Royal. If he qualified for the batting title (and believe me, we’re going to be hearing plenty about that in the coming weeks) his 3.33 P/PA would be tied for dead last in the American League with Johnny Giavotella. Because Orlando is so hacktastic, he sees more strikes than anyone on the Royals. Makes total sense that 71 percent of all pitches he sees are registered as strikes. That would rank as the highest strike rate in the AL. Currently, Alcides Escobar is leader with a strike in 70.5 percent of all pitches seen.
You simply can’t make up this kind of stuff.
4.1 – Salvador Perez is striking out once every 4.1 at bats, and you know what? That’s perfectly fine. With a .272 TAv over close to 400 plate appearances, he’s on track for his finest offensive season since 2013. That was the last season he caught less than 140 games. For his career, Perez has a 6.6 AB/SO rate, which is always been better than league average. Lord knows we need a more aggressive Perez at the plate, but his approach seems to be working for him. He’s barreling the ball a little better than in the past and is certainly driving the ball more than he has the last couple of seasons. His 0.5 GB/FB ratio is the lowest of his career which has lead to more extra base hits. Over 10 percent of his base hits have gone for extra bases this season, which if it continues through the end of the year, would be his best XBH% of his career.
5.4 – Eric Hosmer sees a 3-0 count in 5.4 percent of his plate appearances. That’s the most on the team and when compared to the league average of 4.5 percent, that’s a decent rate. This number leads us into some sort of Hosmer batting split rabbit hole. After he has a 3-0 advantage, the Royals’ first baseman is batting .400/.760/.700. In 25 plate appearances with a 3-0 count, Hosmer has walked 15 times. In nine of those, he’s taken ball four on the very next pitch. Of the 10 times he hasn’t walked, he’s collected four hits – three singles and a home run. He’s also struck out once.
It’s all so easy, right? For Hosmer to break out of his extended slump all he has to do is get the count to 3-0. There’s your solution.