If you had asked me in April, I would have said there was no way we would be discussing this sort of thing. But the Royals got back in the race, gradually and then suddenly, and here we are. With two months to go, it’s time to once again examine the remaining schedule for Kansas City and the other playoff contenders. There’s no way to answer the question everyone wants to know, but we can at least assess their chances of nailing down a playoff spot.
For this exercise, I simply multiply the number of times Team A plays Team B by Team B’s wins and losses. I cut this off at any team more than five games out of a wild-card spot, so apologies to Texas, Toronto, Detroit, Oakland, and Chicago. I do this for actual wins and losses as well as for a team’s third-order record, as seen on the standings page at the mothership. I refer to these as their weighted winning percentage. When I did this last year, the third-order record predictions were exact more often than the “actual record” predictions (exactly correct on three of 10 teams and off by one win on two others), but the “actual record” predictions were closer on average (exactly correct on two but off by no more than three on any team). I’m curious to see how that works this year since last year’s article was published in late August, with almost a month’s worth of extra data.
The good news for the Royals is that they appear to have a softer schedule than Cleveland. Royals opponents have a weighted actual winning percentage of .489. Meanwhile, Cleveland’s opponents are at .497. Appearances may be deceiving, though: Royals opponents have a third-order winning percentage of .502. while Cleveland’s are at .495. The Indians still have six games against Boston and seven against the Yankees (the Royals have one makeup game in the Bronx in late September). But the bad news for the Royals is that, while they have 10 games left against Cleveland, seven of them will be on the road. The division title is certainly in play, even though (perhaps not surprisingly), the third-order winning percentage seems to think Cleveland is a lot better than the Royals. I hate to say it, but that does match the consensus prior to the season. This Royals team has made a habit of making computer predictions and formulas look silly; perhaps they can do it again.
If the Royals can’t capture the division, they should still have a good shot at a Wild Card spot. Their closest pursuers, Tampa Bay and Seattle, are both 2.5 games back. They also face much tougher schedules. Here, the Royals may get a break by playing in the AL Central, with poor White Sox and Tigers teams and a fading Twins squad. The Rays face opponents with a weighted actual win percentage of .514 (and weighted third-order win percentage of .513) the rest of the way; the Mariners are at .505 and .507, respectively. Both teams have to come to Kansas City for a series; obviously, those are some big games.
Seattle’s problem is not as obvious as you might think. They face the Houston Astros juggernaut just six times the rest of the season. But they also face the Royals four times, Cleveland three times, New York three times, and Tampa Bay three times.
Meanwhile, the Rays have the double whammy of eight games against Boston and six against New York. They also have three games against Milwaukee, three against Houston, four against Cleveland, two against the Cubs, and those three games against Seattle.
This chart shows the weighted actual and third-order winning percentages for each contender’s remaining schedule:

Now, we can use the log5 method created by Bill James to predict each team’s win total, based on their win percentage and the win percentages of their opponents. This chart shows the predicted win total for each team based on actual win percentage and third-order win percentage of their collective opponents.
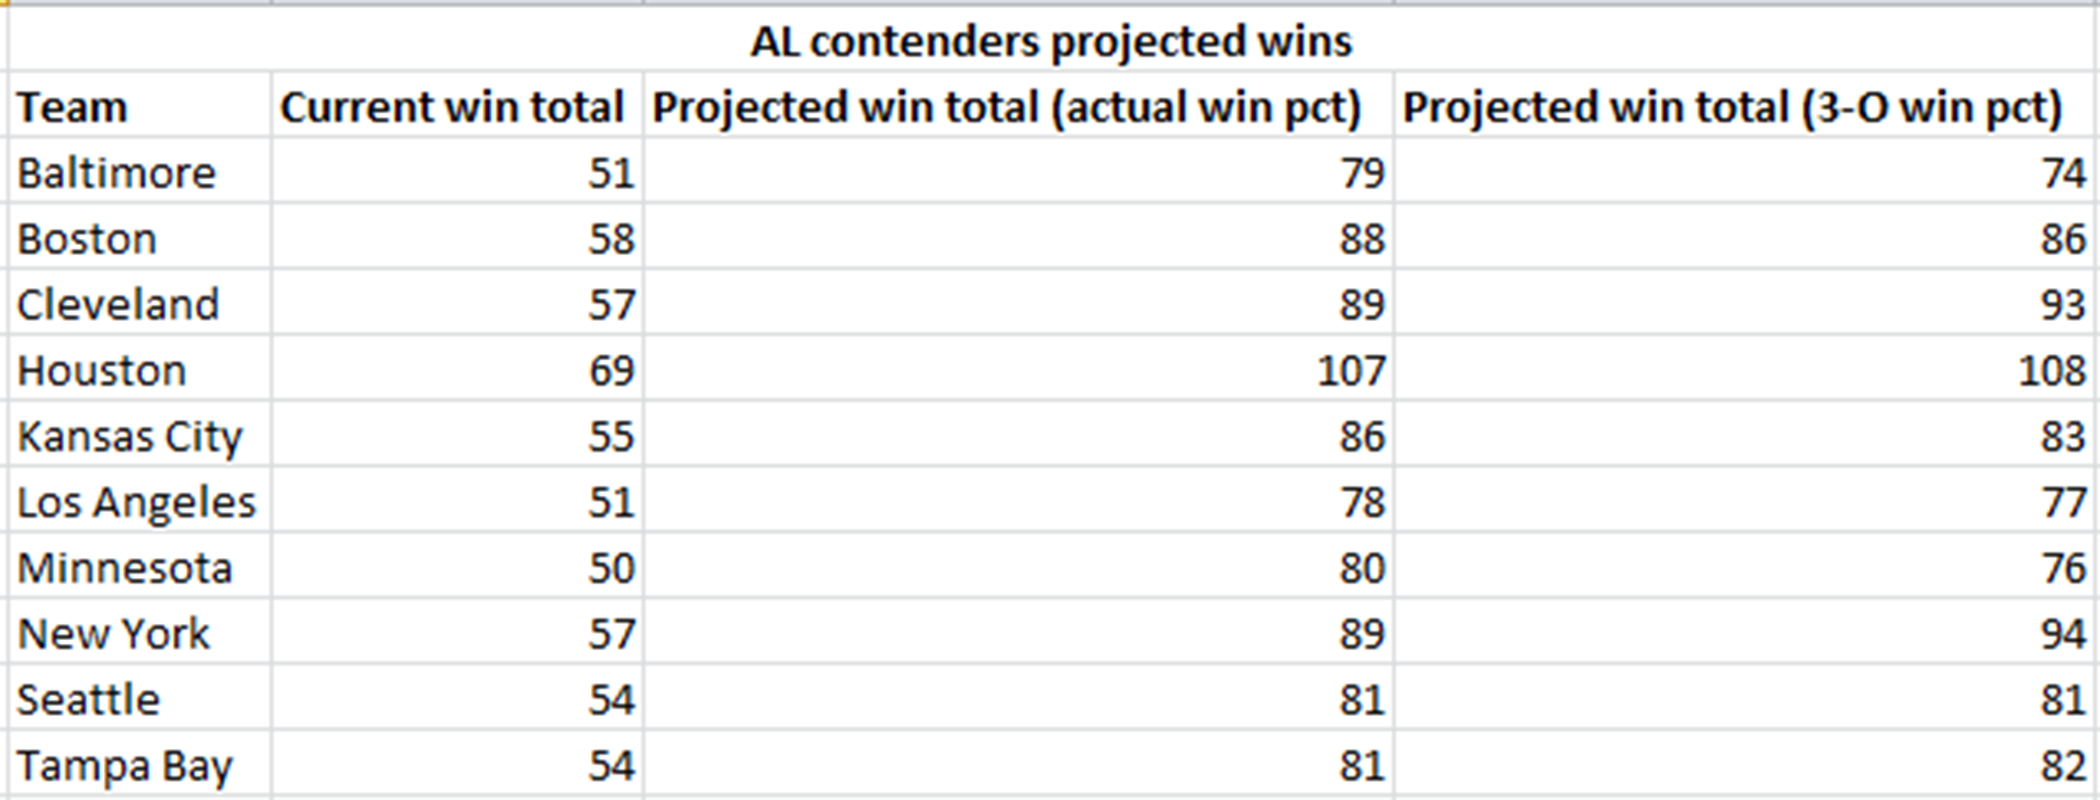
Obviously Houston is the runaway favorite to have the best record in the league. I’d be a little surprised if they finish with that many wins, as they can afford to rest regulars and there is likely a natural “let-up” effect with such a large lead (think of the 2015 Royals). But they should win 100 games; just going .500 the rest of the way puts them around 97 wins.
In the Central, it’s apparent the Royals have a good chance for a division title. As mentioned, third-order win percentage is a lot more impressed with Cleveland than Kansas City; I wish I could figure out the numbers since May 1, when the Royals remembered how to hit a little. You still have to like the Royals’ chances at a wild-card spot, at least.
And in the East, New York has impressed the computers more than Boston has. As you might expect, the two rivals have plenty of games left against each other (10 to be exact). Tampa Bay has put together a nice season but their tough remaining schedule may hurt them.
1 comment on “A Look At The Royals’ (And Other Contenders’) Remaining Schedules”
Comments are closed.