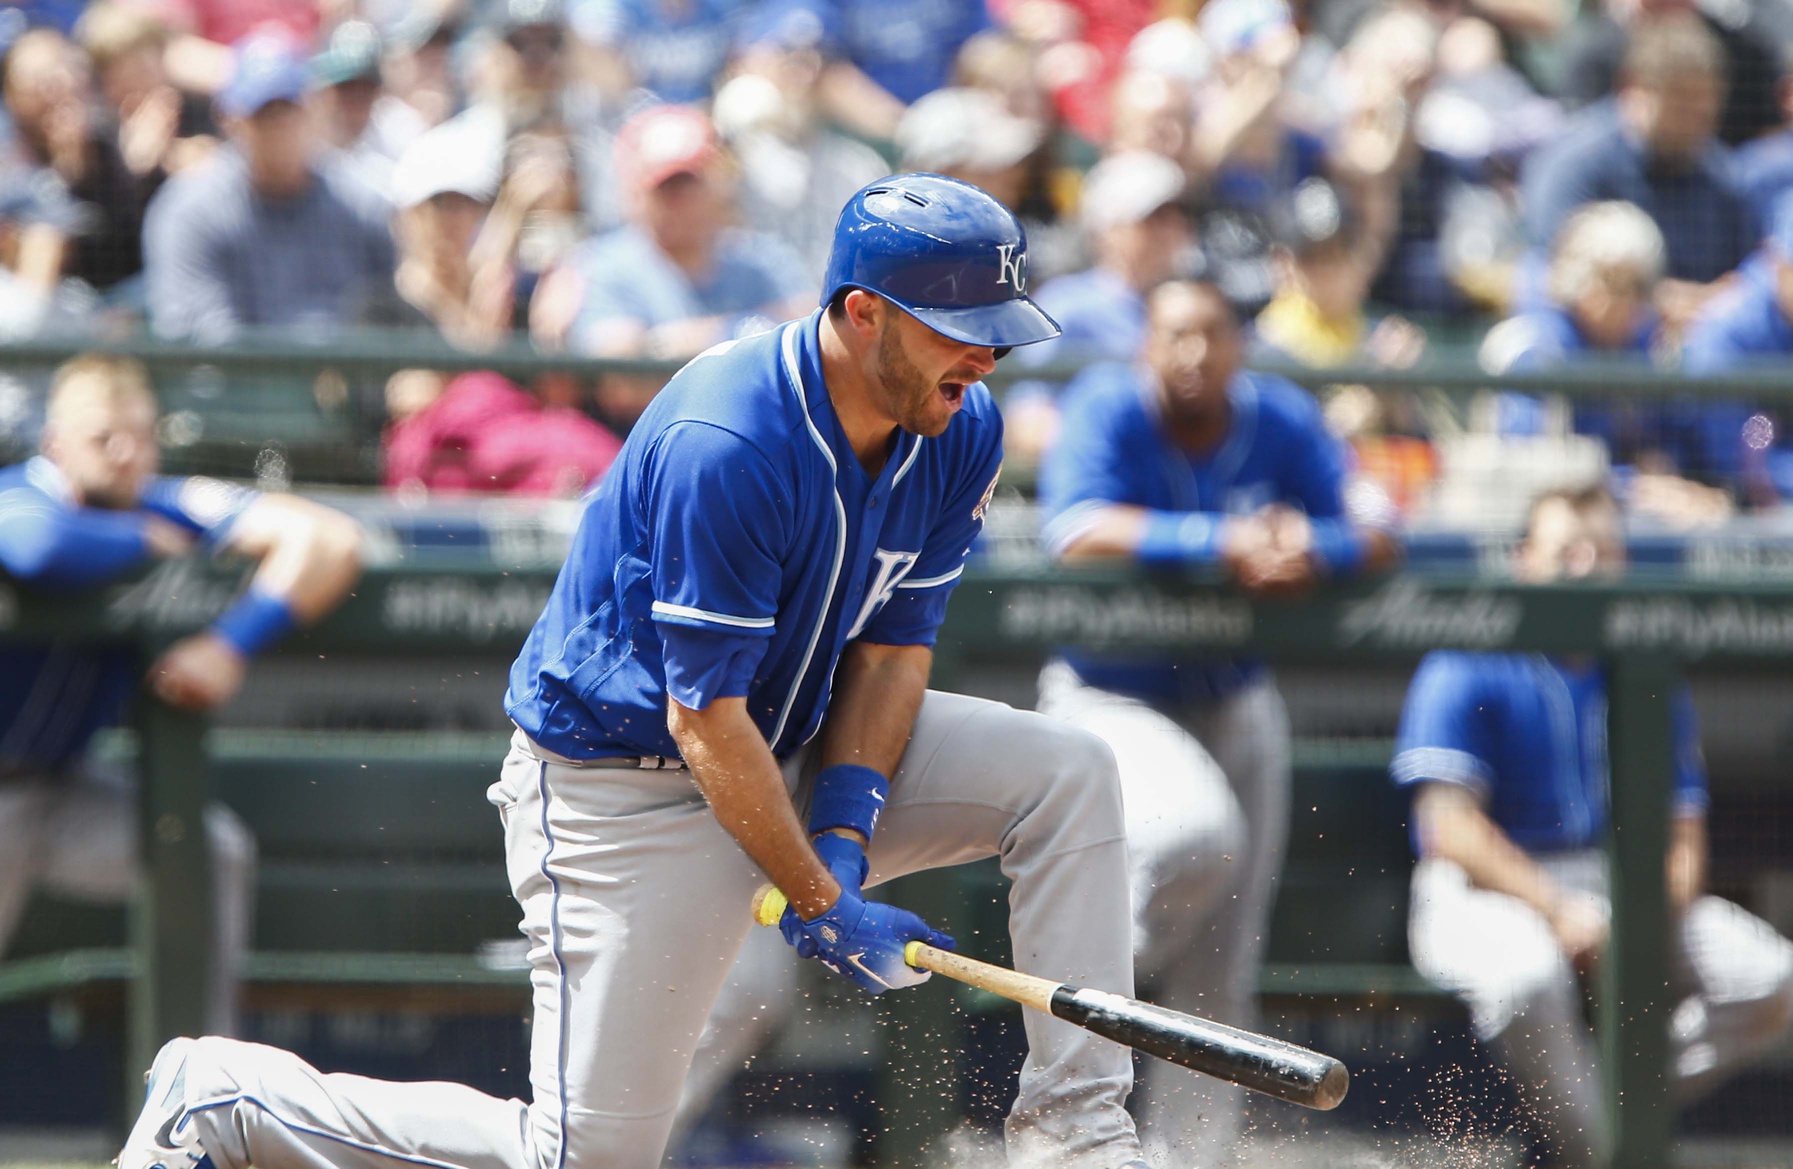
The Royals reached the midway point of the 2018 season over the weekend. But who marks time when you’re in a season of baseball hell?
They have since dropped all four games to open the de facto second half. Plus ça change, plus, c’est la meme chose.
This is where the struggle brings us. Yes, the Royals need to tank. They need to lose games to bump up the draft board for 2019. They also need to draft smart and they need to develop players. Tanking is measured in increments that can make the entire process frustrating. Yet on Monday, a milestone of sorts was reached when the Royals finally placed a prospect on the Baseball America Top 100 list as Khalil Lee arrives at #99 with a bullet. This is the first time the Royals have had a player on this list since the Eisenhower administration. (That may not be accurate.)
Personally, I’m on Team Tank. There’s no value in winning 72 games. It just gives you a middling draft pick and a false sense the second Wild Card was just out of reach. I mention 72 wins because if you’re being completely honest with your preseason expectations, that was really the best case scenario for this Royals team as far as records go.
Yet in the short-term, 72 wins gives you something to feel good about. The 2018 Royals have won exactly 25 games through their first 84. That’s a .298 winning percentage.
In the expansion era (1961 to present) only two teams have finished a full season with a winning percentage under .300. We are on track to see two more teams added to this ignominious list.
| Rk | Year | Tm | Lg | Wtm | Ltm | tmW-L% | #Bat | R/G | G | PA | AB | R | H | 2B | 3B | HR | RBI | SB | CS | BB | SO | BA | OBP | SLG | OPS | TB | GDP | OPS+ |
|---|---|---|---|---|---|---|---|---|---|---|---|---|---|---|---|---|---|---|---|---|---|---|---|---|---|---|---|---|
| 1 | 2018 | KCR | AL | 25 | 59 | .298 | 32 | 3.46 | 84 | 3139 | 2851 | 291 | 673 | 136 | 10 | 67 | 274 | 39 | 16 | 219 | 628 | .236 | .297 | .361 | .658 | 1030 | 80 | 81 |
| 2 | 2018 | BAL | AL | 24 | 59 | .289 | 36 | 3.67 | 83 | 3119 | 2839 | 305 | 645 | 122 | 9 | 98 | 297 | 28 | 8 | 229 | 740 | .227 | .290 | .380 | .670 | 1079 | 65 | 86 |
| 3 | 2003 | DET | AL | 43 | 119 | .265 | 35 | 3.65 | 162 | 6071 | 5466 | 591 | 1312 | 201 | 39 | 153 | 553 | 98 | 63 | 443 | 1099 | .240 | .300 | .375 | .675 | 2050 | 114 | 83 |
| 4 | 1962 | NYM | NL | 40 | 120 | .250 | 45 | 3.83 | 161 | 6242 | 5492 | 617 | 1318 | 166 | 40 | 139 | 573 | 59 | 48 | 616 | 991 | .240 | .318 | .361 | .679 | 1981 | 122 | 82 |
The cool thing about running a table such as the one above this close to the midway point in our season of despair, you can easily extrapolate the numbers to see how the Orioles and Royals stack up offensively in a full season with the 2003 Tigers and the 1962 Mets.
It’s about time I uploaded that gif. It has the potential to land in every post between now and the end of September.
The ’62 Mets, the poster children for expansion futility, finished with a -331 run differential. The ’03 Tigers had a -337 run differential. The Royals, after their lopsided loss to Francisco Lindor the Cleveland Indians on Monday, now own a -164 run differential. Again, we can simply double that (not entirely accurate, but who’s counting?) and… Yikes!
The Royals are on pace for a -328 run differential.
Now you can’t really do that for something like run differential. Things happen, like big wins and massive losses. A stretch of better baseball than we’ve seen for the entire year could lop 30 runs off that total in a week. (Really!) The point isn’t to look into the crystal ball, but merely to say (again) that the 2018 Royals come by their awfulness in an honest fashion. There’s no bad luck. Only bad baseball.
That doesn’t make you feel any better since you plunked down $50 for seats down the third base line for the privilege of buying a $14 beer to go along with your moldy hot dog.
And forget run differential for a moment. Just let your eyes glaze over at that offensive futility that is the Royals offense. They’re worse than the other three teams in just about every offensive category. They score fewer run than the bunch. And when you figure at some point they will be subtracting Mike Moustakas through trade (.258/.312/.472 with a 113 OPS+, the only Royal besides Whit Merrifield who is above average offensively) and this team has a shot at some seriously depressing records.
Here’s some fun information you can use at your Independence Day party. The Royals were 13-15 in May. That’s a pretty decent record and it works out to a .464 winning percentage. Respectable. Now reach into the schedule and rip the month of May out and the Royals record is 12-43. That’s a .218 winning percentage.
(Never mind you can’t actually discard an entire month from the standings. Can you imagine the anarchy if this was allowed?)
I stumbled upon this fun exercise with arbitrary endpoints when I was double checking to make absolutely certain the Royals have not had a winning streak of longer than three games this year. They haven’t. I found myself mesmerized by this, courtesy Baseball Reference.
So much red. And big bars, too! That’s what a -164 run differential looks like midway through a season.
And it’s probably going to get worse before it gets any better.


They are tanking since the beginning of the year. How else do you explain Escobar playing everyday (now even in the outfield and at 3rd), the Almonte -Almonte swap, Boyer, Grimm, Maurer?
May was just typical Royals-bad-luck winning all those games.
Just saying.
I think it is fair to say that this team has suffered the flip side of all those good bounces and luck that the 2013-2017 teams got.