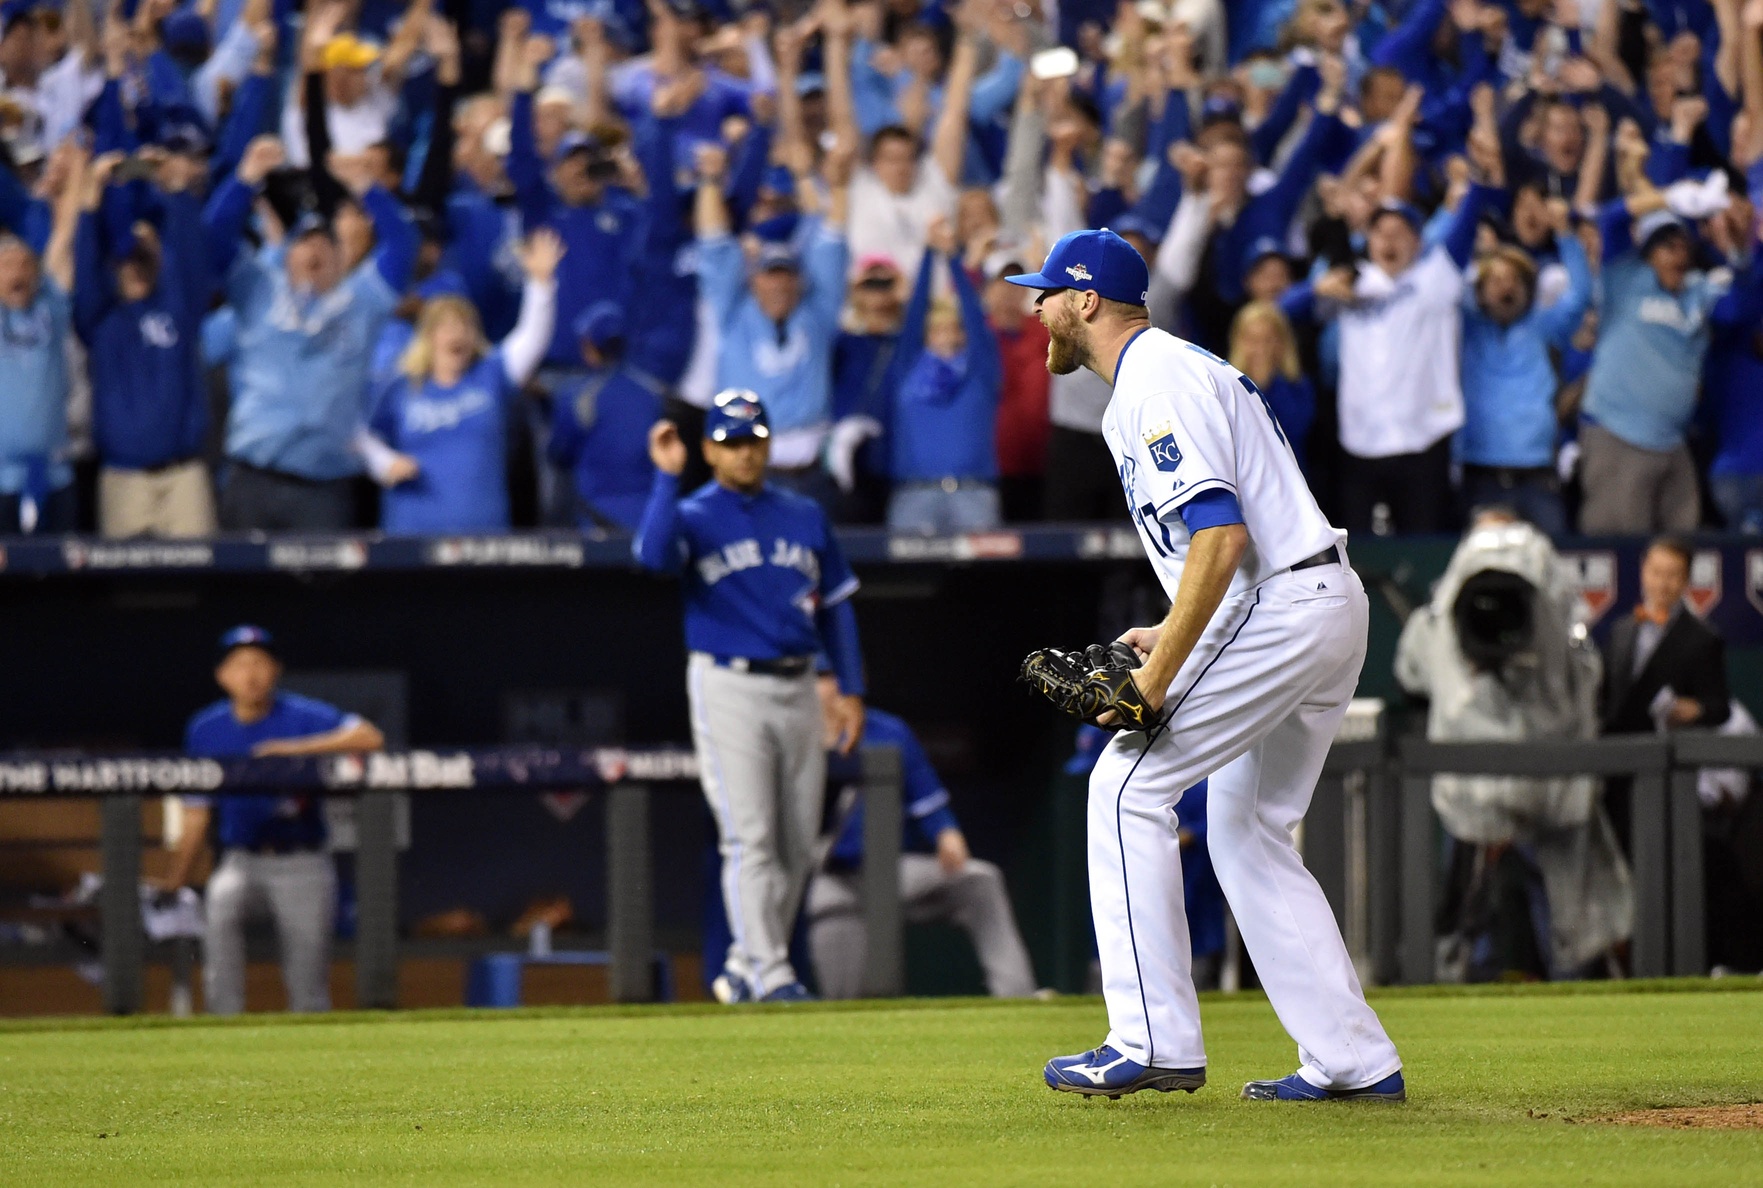
With Wade Davis on his way to the north side of Chicago, I began wondering if it was possible to assess accurately where he might fit in the history of Royals closers. This is a topic I’ve been thinking about for some time, but I could never quite figure out how to get an accurate comparison.
Raw saves doesn’t really do his ability justice. Davis leaves Kansas City in ninth place in team history with 47 saves. But he was only the closer for a year and change, taking over when Greg Holland had Tommy John surgery in 2015. Davis ranks behind Jeff Montgomery, Dan Quisenberry, Joakim Soria, and Holland, of course, but also behind Doug Bird, Mike Macdougal, Roberto Hernandez, and Steve Farr. Those last four were all fine pitchers for the Royals, but never approached what Davis has done.
The evolving role of the closer through the years also makes comparisons tough. Quisenberry averaged 132 innings in 1980 and 1982-1985 (throwing out the strike-shortened 1981 season); Davis threw 182 2/3 innings total the last three seasons. The job was simply different in the early 1980s; Quiz would pitch multiple innings in many games. Not that he depended on an overpowering fastball, of course, but he had to pace himself a bit. Same for Montgomery, to a lesser extent. Davis had the freedom to go as hard as he could for one inning at a time.
Those different pitching styles also make comparisons difficult. Davis piled up the strikeouts; he had 234 over the last three seasons. Quisenberry had 321 in 10 years as a Royal. Obviously Davis was more dominant. But was he more effective?
The shortness of Davis’s stint as closer also hinders comparisons. Counting stats like WARP are skewed (Quiz has 10.5 as a Royal; Davis has 5.1, but 4.5 as a reliever). I suppose I could frame it as WARP per innings pitched or games or something, but that seems like a Franken-stat a little bit.
So perhaps the best thing to do is just look at each guy’s three peak seasons as a Royal side-by-side. I used WARP as a guide for each pitcher’s three-year peak, but I made an exception for Soria (whose best WARP score was in 2007, when he was not the closer). The caveat here is that WARP is partially dependent on DRA, and I wonder how accurate that can be for older players due to limitations in the available data. I think that is a minor quibble, though.
| Pitcher | Years | ERA | G | SV | BSv | IP | H | R | HR | BB | SO | ERA+ | WHIP | WARP |
| Quisenberry | 82-84 | 2.38 | 213 | 124 | 26 | 405 | 365 | 117 | 28 | 35 | 135 | 171 | 0.988 | 5.3 |
| Montgomery | 89-91 | 2.21 | 203 | 75 | 22 | 276.1 | 230 | 84 | 15 | 87 | 265 | 179 | 1.147 | 6.6 |
| Soria | 08-10 | 1.84 | 176 | 115 | 9 | 186 | 136 | 40 | 14 | 51 | 206 | 235 | 1.005 | 5.2 |
| Holland | 12-14 | 1.88 | 200 | 109 | 9 | 196.1 | 135 | 46 | 8 | 72 | 284 | 218 | 1.054 | 6.5 |
| Davis | 14-16 | 1.18 | 185 | 47 | 7 | 182.2 | 104 | 25 | 3 | 59 | 234 | 351 | 0.892 | 4.5 |
Someday, younger fans perusing the Royals’ record books may wonder why Davis has such an important place in fans’ memories. He ends his Royals career holding very few team records, and isn’t even in the top 10 in many categories. But those of us who remember him will know that he had the most dominant three-year stretch as a reliever in team history. Of course he didn’t have the longevity of a Quisenberry or Montgomery, but his peak was higher than any other pitcher who has worn Royal blue. Is he the best closer in Royals’ history? I feel confident in saying that he was. The astonishing WHIP Davis put up actually has some competition from Quisenberry. But nobody is touching that ERA+. Perhaps not surprisingly, looking at it from this angle shows just how dominant Davis was as a Royal.

Wow, funny how last season makes you forget how good Soria was.